For those of you that follow these daily posts, you will know that we like to watch and trade a wide variety of markets and Forex pairs, and in today’s Daily Forex market commentary, I am going to look at what the US stock index and the S&P 500 is doing and where Nat Gas is going because both of these markets have had a heck of a lot of interest in them in recent times, as I will go into.
US Stock Markets
There has been a heck of a lot of interest in the world stock markets over the last few weeks and months, with a lot of big world events happening, such as the ongoing civil wars, which is causing the human refugee crisis, the VW diesel vehicle scandal, which is going to cost billions of dollars, and other major issues, such as what the US is going to do with interest rates? And, what is really going on in China?
With that in mind, we need to remember what “our” jobs as price action traders are because it is super easy to get lost in the nightly news and never ending new streams and updates. It can be so easy to think that watching the news and reading the latest financial papers is going to help our trading, but the EXACT opposite is true.
Our job as price action traders is to create a high probability edge over the market where, over many trades, we come out on top. We may have losses and we may have losing streaks, but over many trades, we come out on top and make a profit because the aim of the price action edge is to make a profit overall.
I discuss why this is so important and why it is so important for you to concentrate on price action when creating your edge here: To be a Successful Price Action Trader – Don’t Follow the News
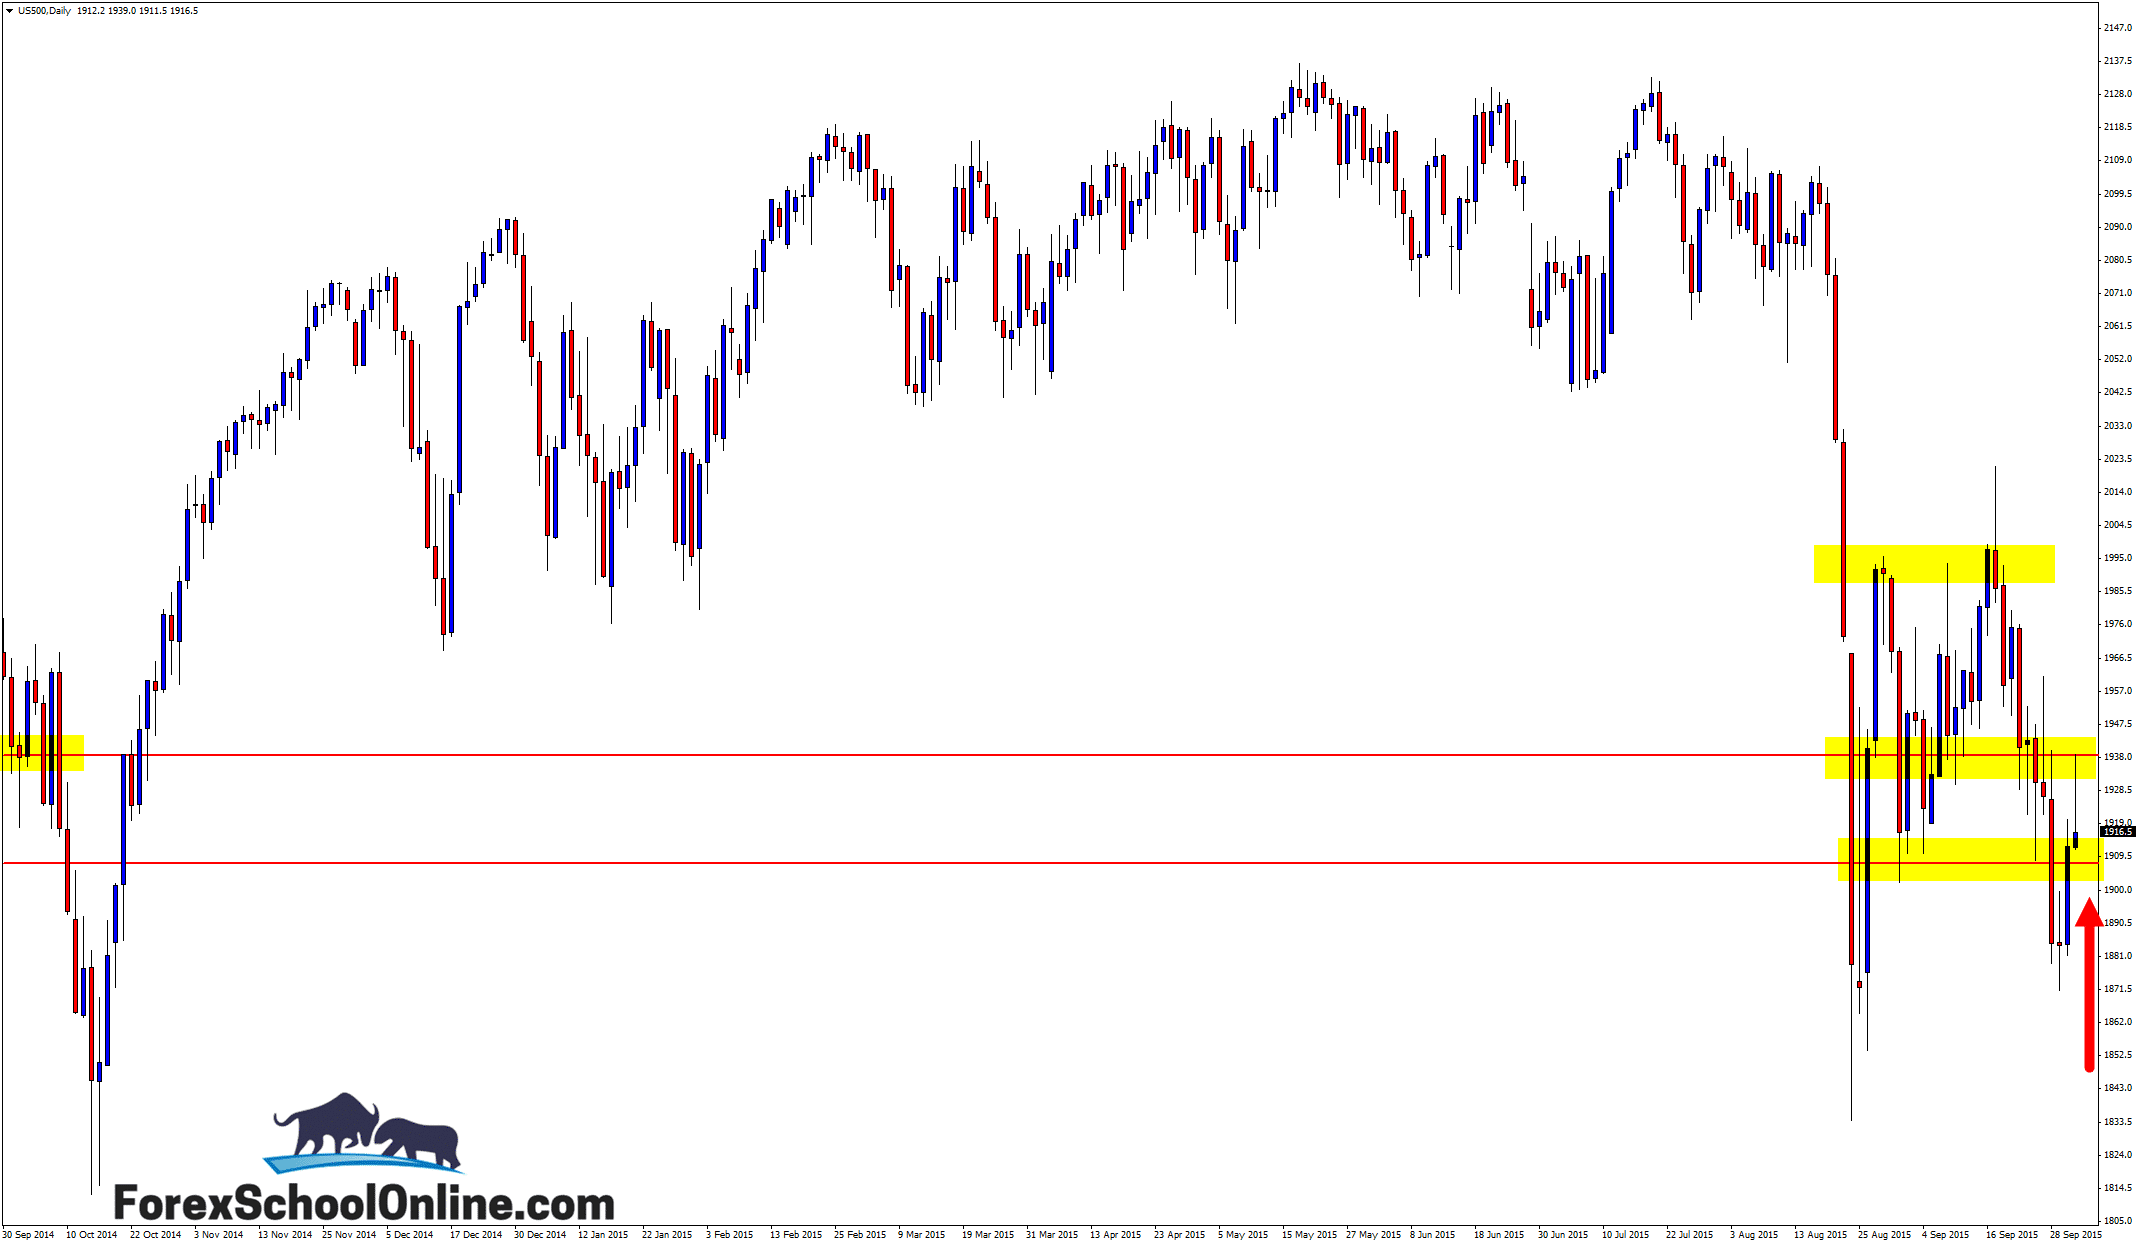
With the US 500 over the last two months, price has made a strong move lower with a particularly strong sell off before moving into a period of consolidation and boxing, which we are in now on the daily chart. Price has now just bounced off the low of this consolidation area and is trying to bust back higher.
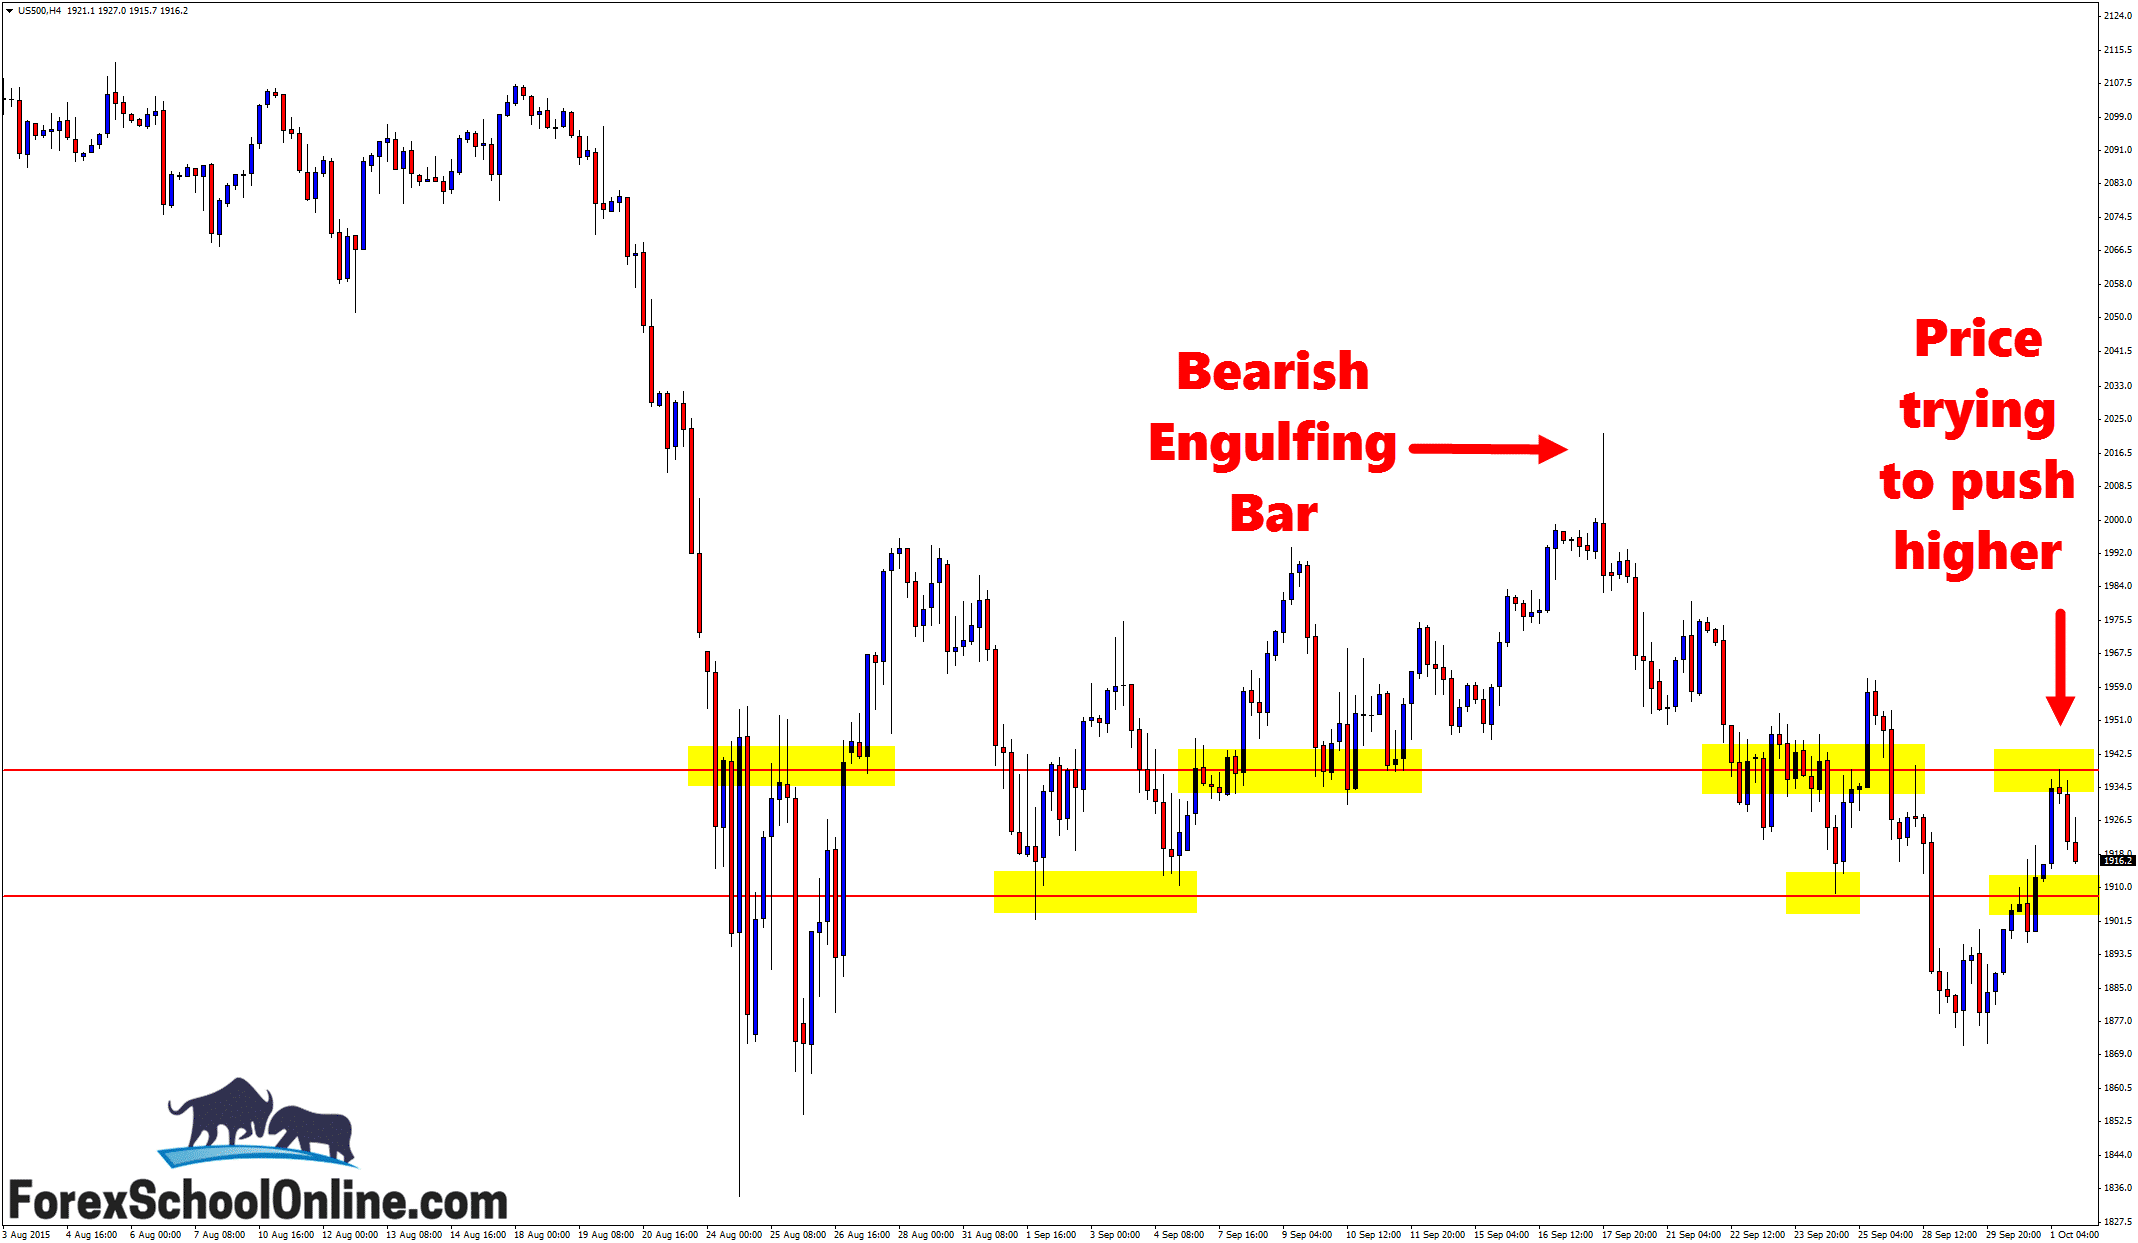
As the 4 hour chart shows below, we are in a very congested and sideways market at the moment and any trading would have to be done with this in mind until price breaks out either higher or lower of this consolidation.
Daily Chart

4 Hour Chart

Nat Gas
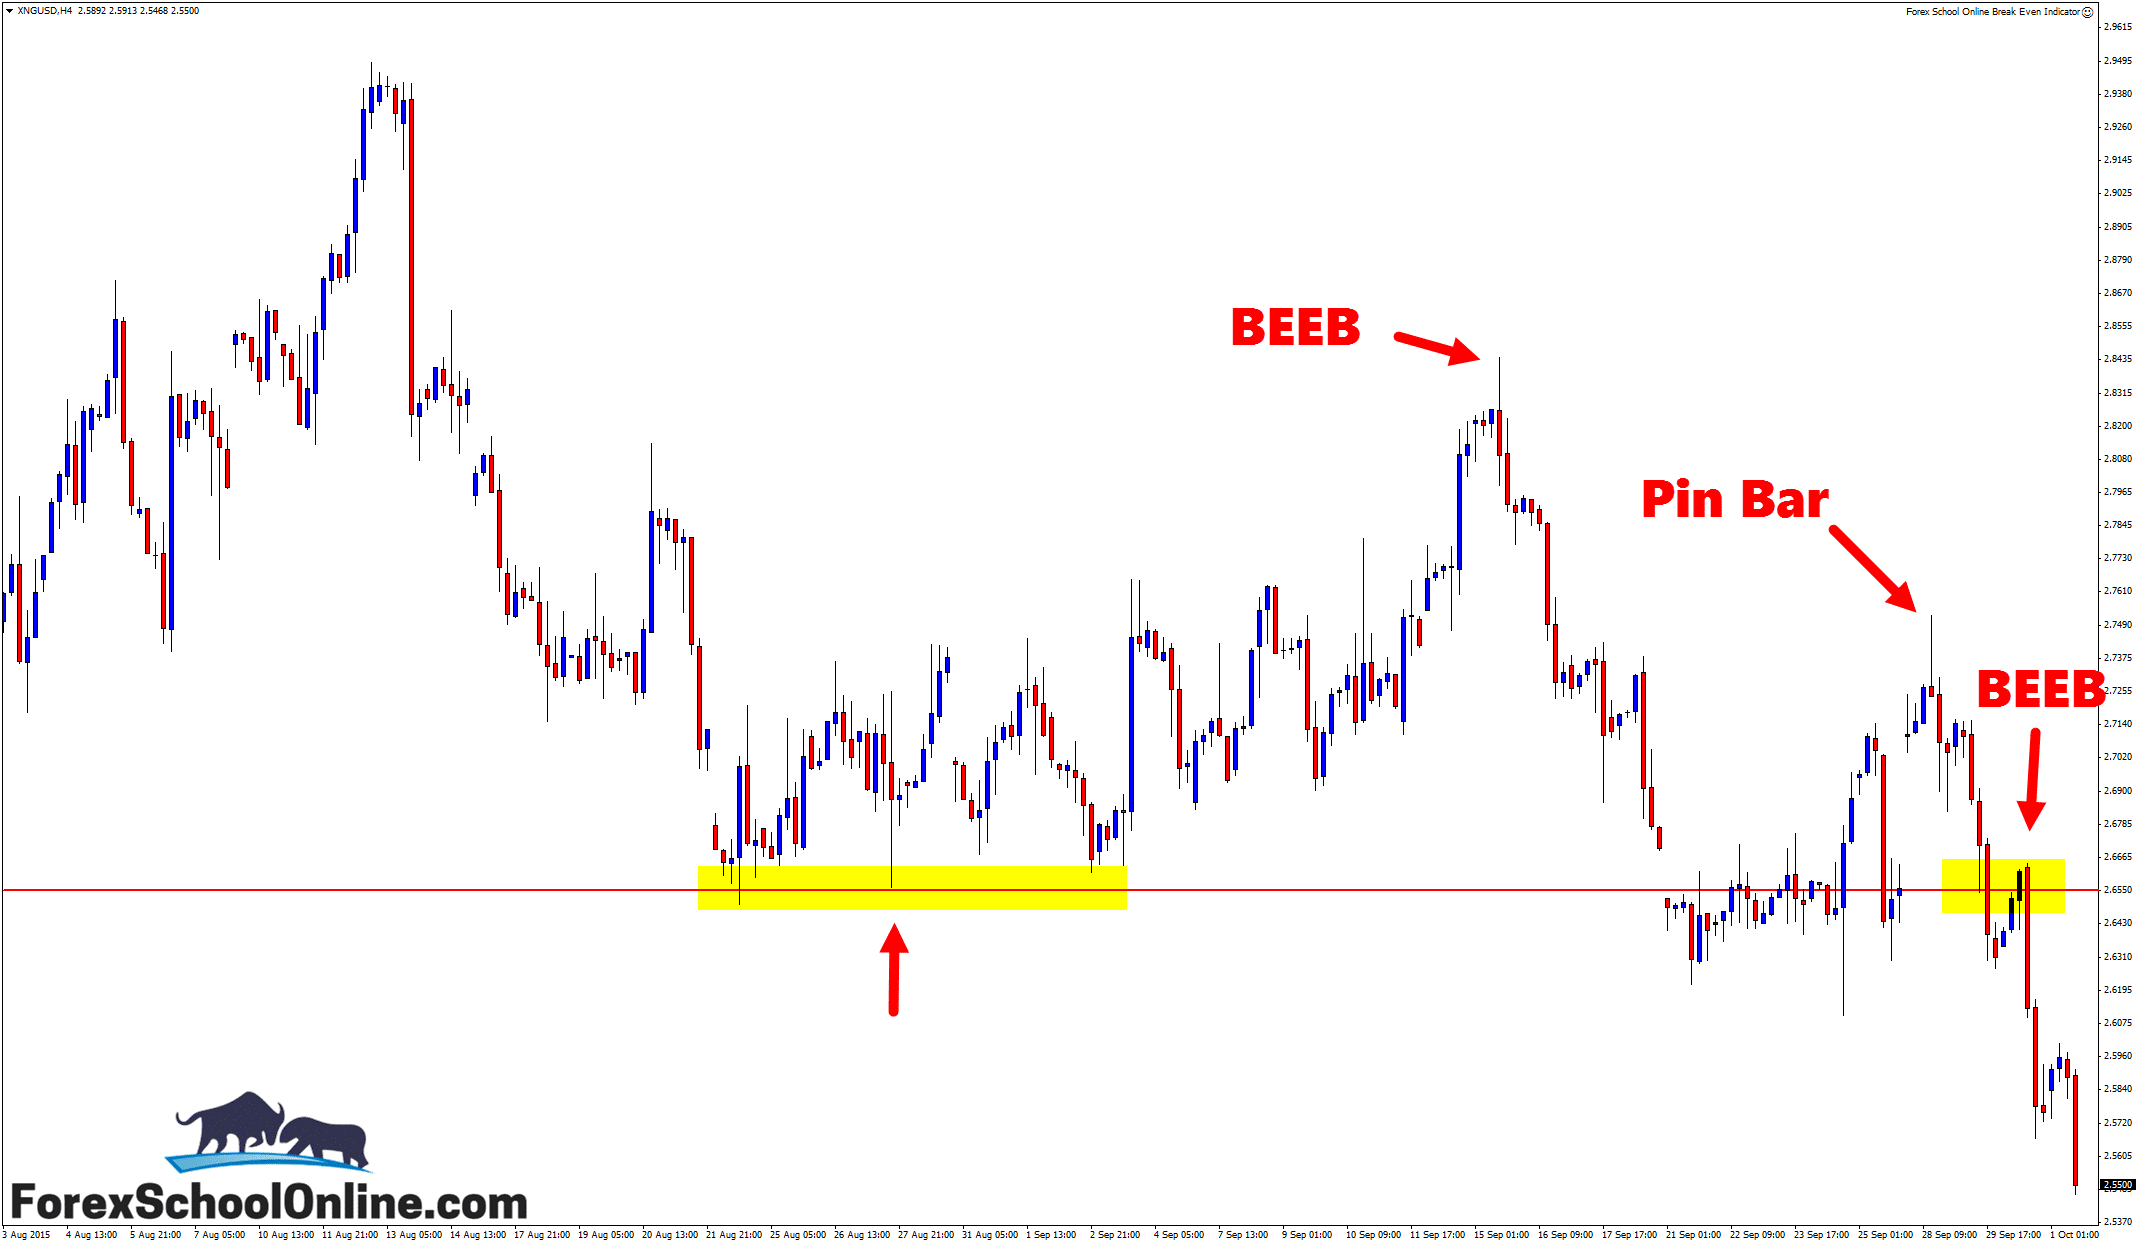
Price has collapsed severely lower on the 4 hour chart of the Natural gas market in recent sessions. After price formed a strong, large, and obvious Bearish Engulfing Bar = BEEB at a major price flip resistance area, as shown on the chart below, price just collapsed and has since made a very aggressive sell off lower.
After forming a 4 hour pin bar in this market that was up at a swing high and sticking out and away from all other price, price has made a substantial move lower that was also through a major daily support level.
If price can continue its strong and aggressive sell off, the next major support level comes in around the daily support level and Very Big Round Number of 2.5000.
4 Hour Chart – Huge Sell Off

Related Forex Trading Education
– To be a Successful Price Action Trader – Don’t Follow the News


Leave a Reply