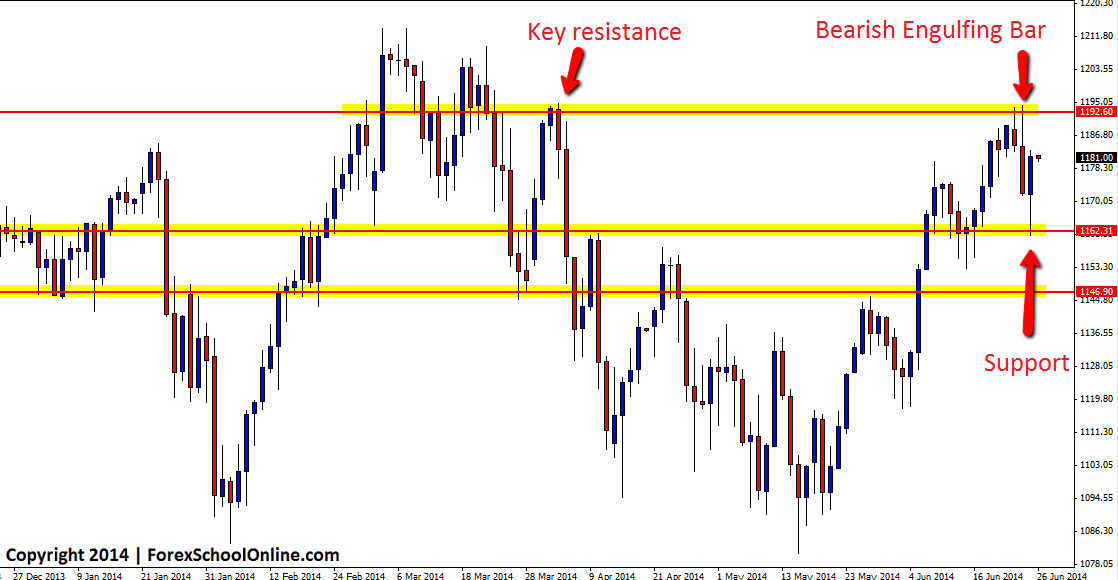
The US Small Caps 2000 has now rebounded higher after falling lower in the previous session. Price had made a steep move lower during the session after a bearish engulfing bar (BEEB) had formed on the daily chart. After price broke the low of the bearish engulfing bar it gained momentum and moved into the near term support where the bulls came out in full support to push price back higher to finish the day and session back higher than where it started.
This Bearish Engulfing Bar was up at a swing high and rejecting a clear key daily resistance level. These critical daily resistance levels can be super levels to hunt for trades on all time frames from the daily time frame through to the intraday time frames such as the 8hr, 4hr and 1hr charts.
Hunting for trades at key daily areas such as on the chart below, but on intraday charts can often mean that the trade then has more space to move into than if the trade was taken on the daily chart. Because the near term support was so close for this daily bearish engulfing bar and price was a high chance to find support and bounce higher, a better option may have been to look for trades on a smaller time frame chart where there then would have been more space to the first level and more potential profit to be made on the trade. I discuss how this works in more detail in the video lesson The Secrets Traders Can Learn From Price Action & Candlesticks
Traders looking to find the correct New York close 5 day charts that offer a range of other markets to trade such as the major stock indices & commodities on top of their Forex pairs, can check out my latest article on Recommended Forex Broker & Charts for Price Action Traders as both brokers recommended in that article for traders both inside and outside the US offer a wide variety of markets to trade.
US Small Caps 2000 Daily Chart


Leave a Reply