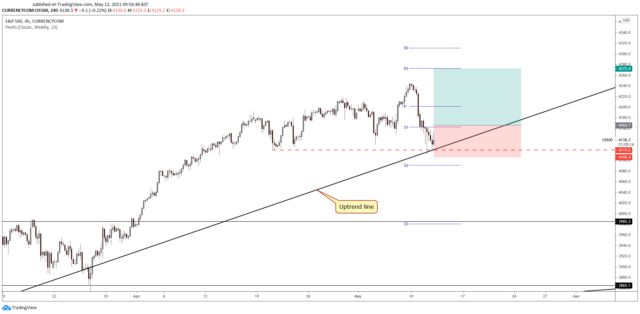
US 500 dropped aggressively in the short term, but the bias remains bullish as the index is traded above the major uptrend line. It has also reached static support, so a bullish pattern here could bring a new long opportunity.
Technically, a temporary decline was somehow expected after reaching a fresh all-time high of 4245.4. SP500 has increased a little today, but we still have to wait for a strong confirmation before going long.
Technical Analysis!

US 500 is traded right above the uptrend line after registering two false breakdowns below it and through the 4119 static support. Staying above these obstacles and coming back above the S1 (4162) could signal a new swing higher.
Testing and retesting the uptrend line or registering a new false breakdown may attract more buyers in the short term.
I believe that only a valid breakdown below the uptrend line and under the 4119 static support could invalidate the bullish scenario.
Note: ForexSchoolOnline is not a financial advisor. Do your research before investing your funds in any financial asset or presented product or event. We are not responsible for your investing results.


Leave a Reply