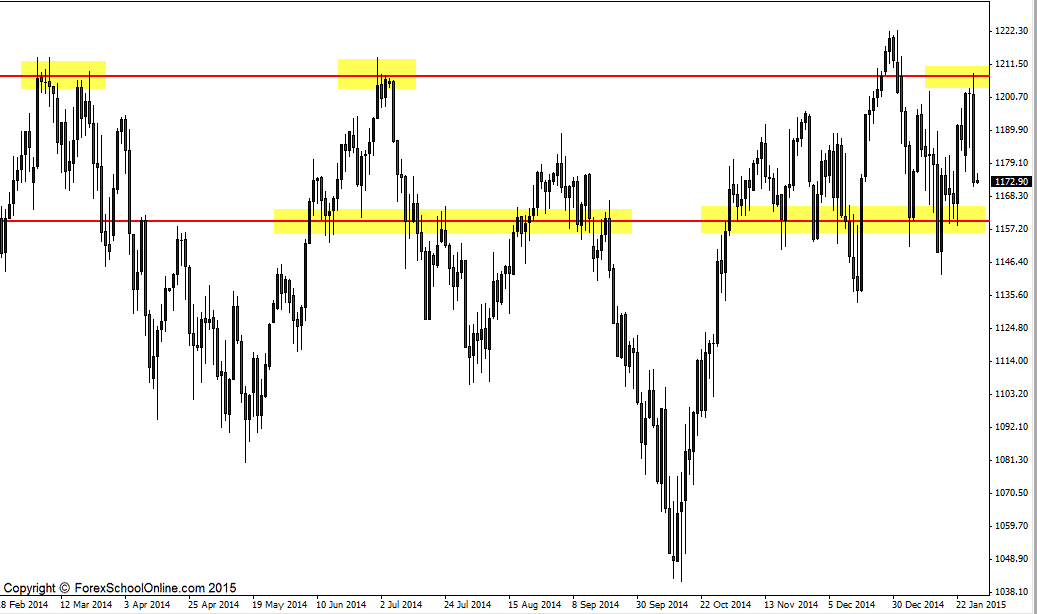
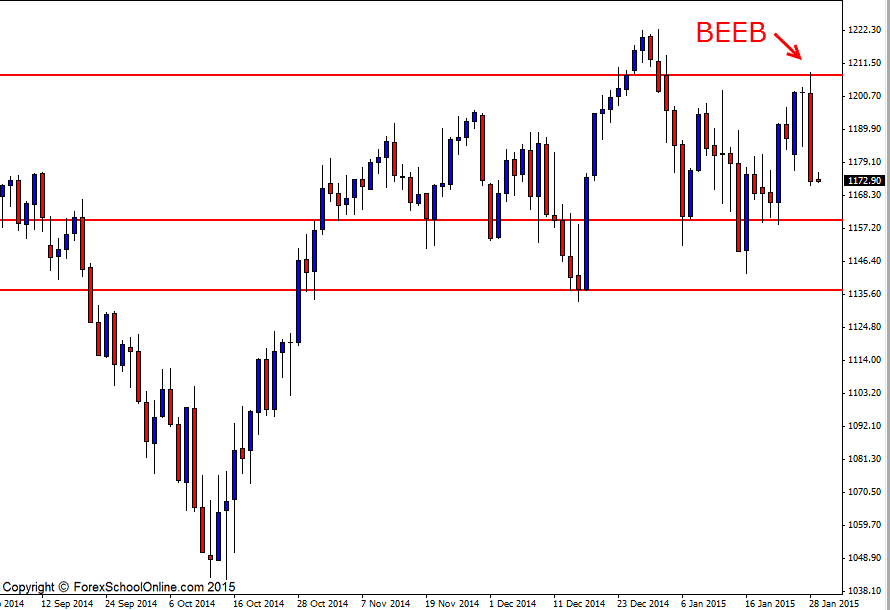
The US 2000 index or the Russell 2000 Index has fired off a Bearish Engulfing Bar (BEEB) on the daily price action chart. This BEEB is up at the swing high and rejecting the major daily resistance area that as the daily chart shows below; has been a major daily resistance level in the past few weeks and months. Price with this bearish engulfing bar tried to move higher and bust through the highs, but collapsed and ended up engulfing the previous three candles and closing right near the session lows showing that the bears ended well in control.
If price can now break and make a move lower the first near term support comes in around the 1159.90 area. This market has been super choppy and ranging of late with no clear trend or strong momentum at all and this means that there is a lot of close support and resistance levels and also trouble areas nearby.
If price can break the first close support level and make a break lower, the next major support comes in around the lows of 1136.95 which are also the major recent range low area. If price fails and moves back higher, then the daily resistance around 1207.50 will look to become heavily tested by the bulls and traders could watch this level very closely for breakout setups or breakout and retrace trades.
Special Note: Make sure you read the latest trading study that is like nothing else I have ever written before for Forex School Online. This new study discusses exactly how some of the biggest professional bank traders in the world deal with their emotions and what strategies they use and also how you can learn from these big guys to make your own trading more successful. To read this new study see here;
A Study on Thinking, Feeling & How Professional Traders React to Emotions
US 2000 Daily Chart – Zoomed Out

US 2000 Daily Chart – Zoomed in


Leave a Reply