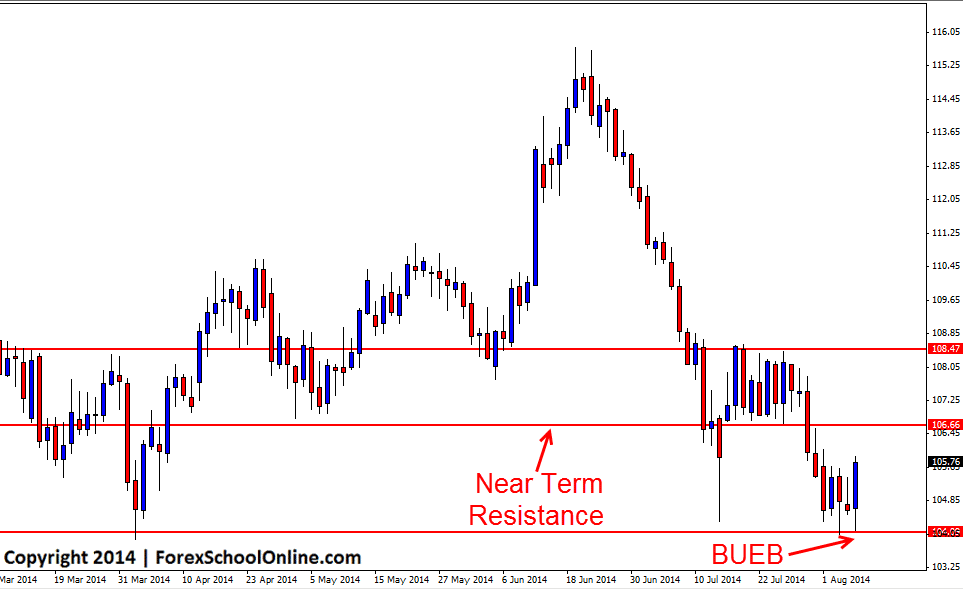
The UKOIL chart has printed off a price action Bullish Engulfing Bar (BUEB) on the daily chart that is engulfing the previous three candles. This bullish engulfing bar is down at the low and is rejecting the recent support that has been tested, but not broken with the recent candle lows attempting to try and break the support.
If this engulfing bar can break higher and confirm the setup which is super important as I discuss in the tutorial Taking High Probability Price Action Entries, then price may be able to gain momentum and push up into the near term resistance around the 106.65 area which has been a very solid proven area in the past. If price can then break this area, the next major resistance comes in around the 108.50 level.
Whilst price in the medium term has made a really stronger move lower, in the recent term price has been stalling and consolidating. This engulfing bar is currently trying to break out of a consolidation period after price stalled at the support low area and if price does move back higher, it will move back into the recent major consolidation area where price traded sideways in a range for an extended period of time. When price moves into these ranges and the consolidation periods, traders have to be on their toes because the market can become quite tricky to trade. Traders will have to watch this market closely to see where it goes over the coming days and weeks.
Daily UKOIL Chart

Really Exciting Note: In the next few days I will be releasing a new article and complete guide for the Forex Tester 2 back testing software that can really help traders. So keep an eye out because this article and guide will also be coming with a really cool discount!


Leave a Reply