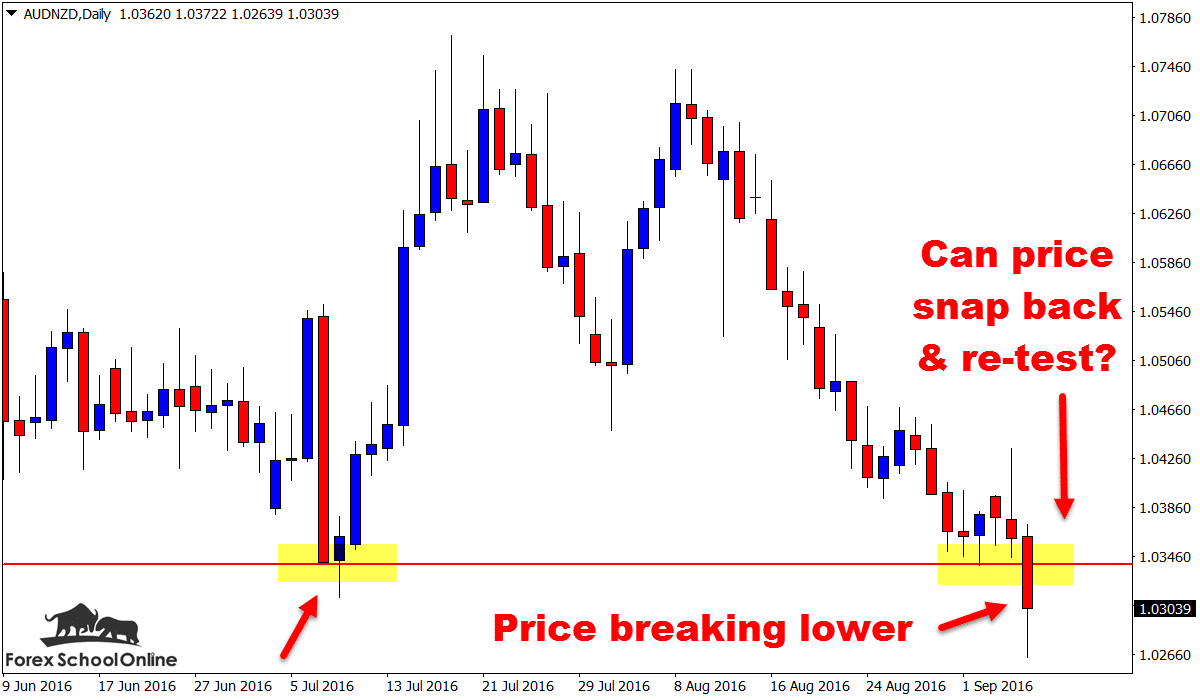
Price on the daily price action chart of the AUDNZD in this current session has broken through and moved below the major price flip support level and is now trading below the important daily level.
This is crucial because, as you can see on the daily chart below, all the recent momentum of late has been lower. This break confirms the momentum, showing that it continues. It also means that bearish traders and those that like to look to trade with obvious trends and momentum in their favor, rather than fighting markets, can look to trade with this move on their side.
After making a double top, price broke lower on the daily chart, continued down up until this point, and as yet has not had any substantial retracements from that double top point.
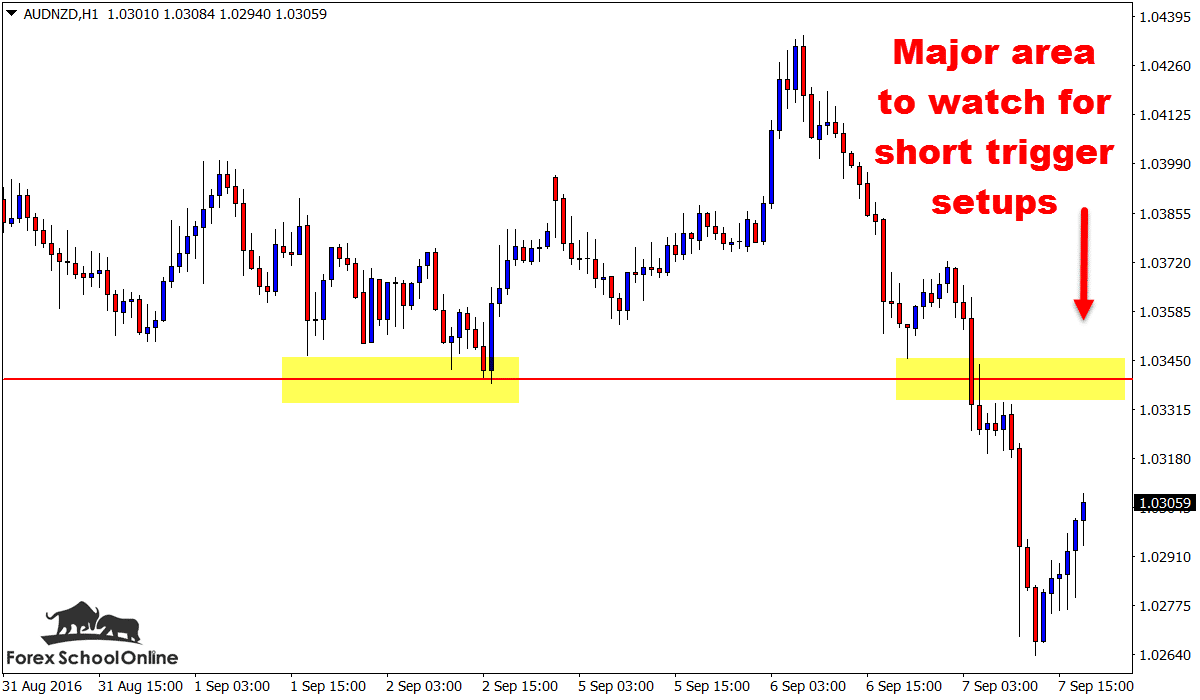
If we get a solid retrace or re-test back into the old higher support / new potential resistance and price flip area, it could be a really high probability area to hunt for short trade setups and trigger signals. This level is quite often what we at Forex School Online refer to as our Kill Zone or Hot Zone. I explain in the lesson at;
Hunting Super High Probability Trigger Signals at Kill Zones
The reason this level is a hot zone or kill zone is because we have the recent strong momentum on our side. That is especially the case if we move to a smaller time frame – the level is a major daily price flip and we can now use this level to hunt trades on smaller time frames as well.
Once we start combining with a really high probability trigger signal like the ones taught in the Forex School Online Members Price Action Course, a high probability trade setup could be potentially confirmed.
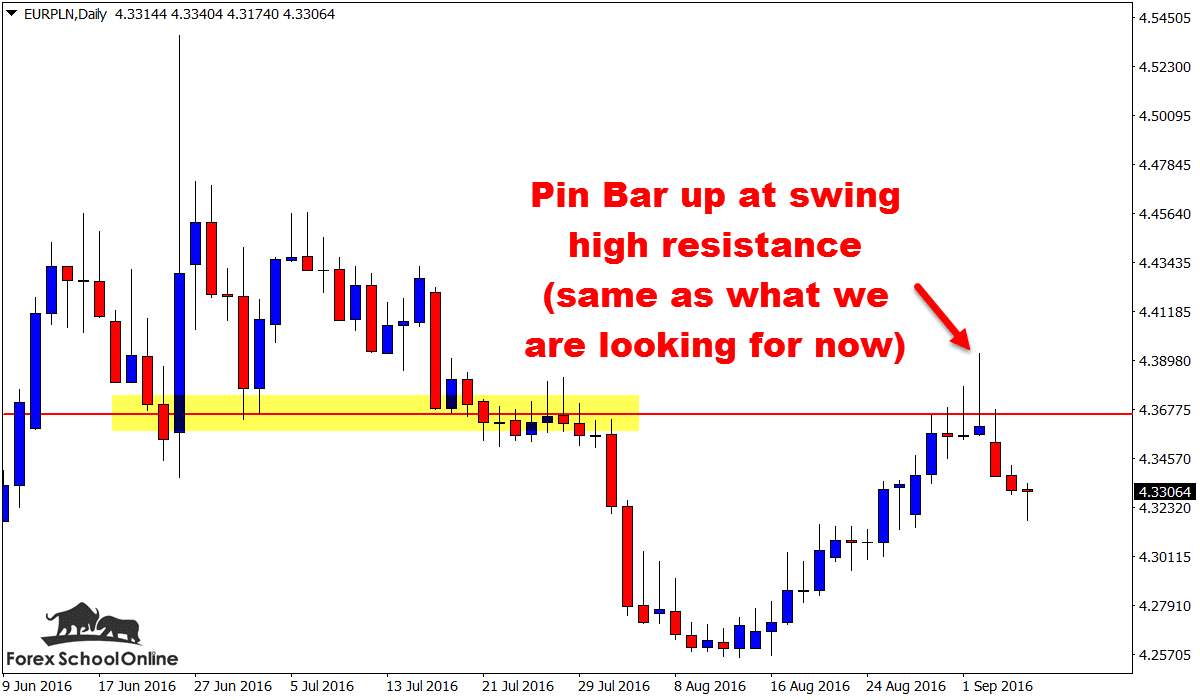
A recent example of a pin bar trigger that had a space, was making a false break, was really large, really sticking out and is similar to what we are looking for here was on the daily chart of the EURPLN chart below:
Daily AUDNZD Chart

Daily AUDNZD Chart

Daily EURPLN Chart

Hunting Super High Probability Trigger Signals at Kill Zones


Leave a Reply