The GBP/USD market continues to show that it lacks direction, attributed to tranquility in market-moving fundamentals. The market is moving sideways ahead of key data and the Fed’s announcements, which are due to roll out later this week. Traders seem to be keeping their fingers crossed on this one. Nevertheless, let’s try to see where the market may head shortly.
Key Price Levels:
Resistance Levels: 1.2700, 1.2800, and 1.2900
Support Levels: 1.2683, 1.2600, and 1.2500

GBP/USD Continues to Hover Around the 21-Day MA Line
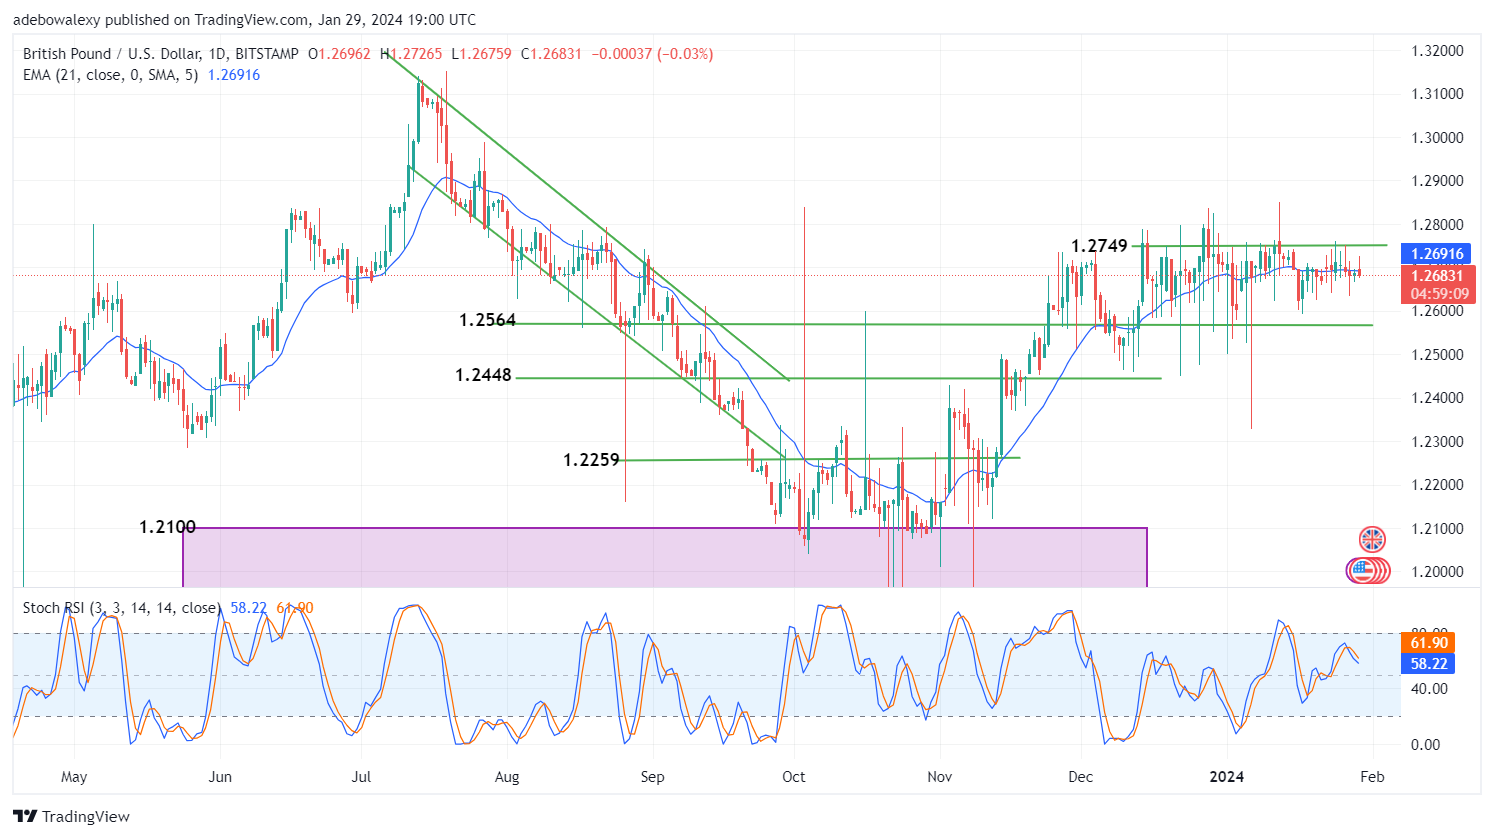
As price action in the GBP/USD market continues to lack a clear direction, it can be seen that the market is still very much around the 21-day Moving Average (MA) curve. Since the past two trading sessions, it can be observed that the price action has crossed below the 21-day MA line; however, there hasn’t been any further significant downward correction since then.
Meanwhile, the last red price candle still has its upper shadow, and its opening touching the 21-day MA line. With the Stochastic Relative Strength Index (SRSI) lines descending towards the 50 mark of the indicator, there hasn’t been much movement in price action towards lower price levels.
GBP/USD Isn’t Facing Significant Selling Pressure
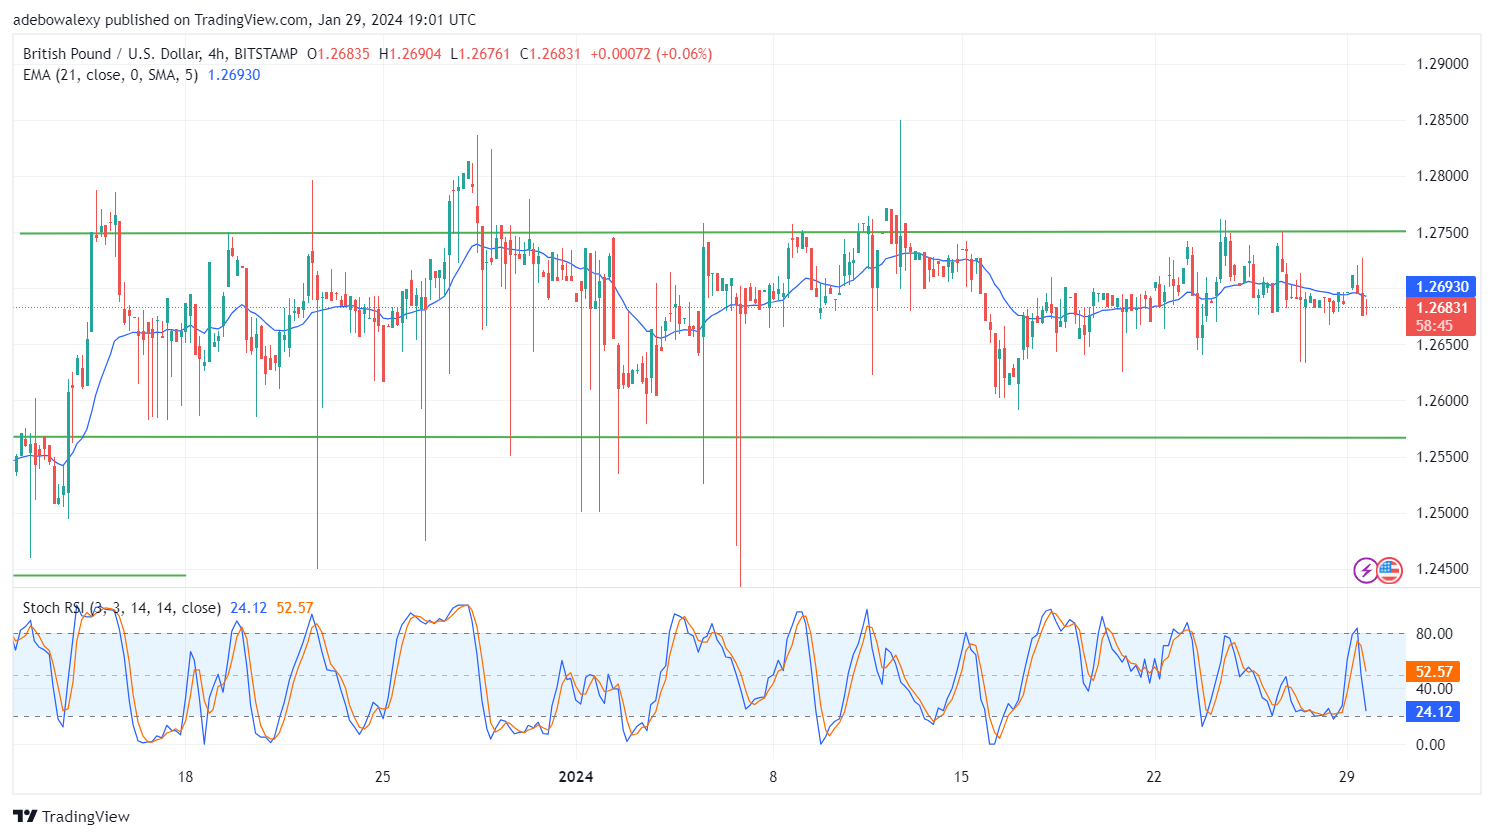
Even studying the GBP/USD pair on a much smaller time frame, the market shows that headwinds lack firm control. Price action had corrected sharply below the 21-day MA line in the previous session. However, the ongoing session, though with bears still winning, has presented some upside correction to the pair, even below the 21-day MA curve.
Meanwhile, the lines of the SRSI indicator leading line have fallen quickly into the oversold region, even with such a minimal downward correction in this market. Nevertheless, traders in this market can still set their trades with forex signals, targeting the 1.2620 support level.
Do you want to take your trading to the next level? Join the best platform for that here.


Leave a Reply