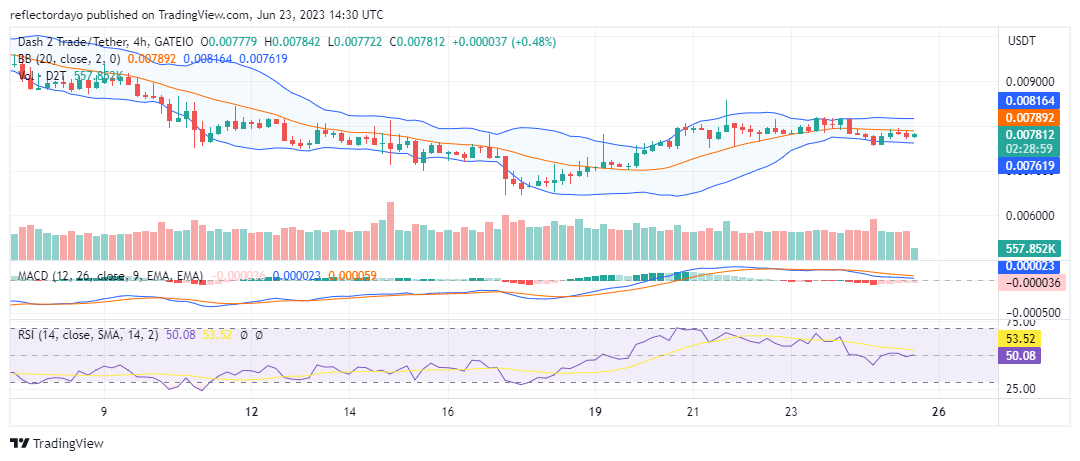
There is more likelihood for an upside break out of the Dash 2 Trade market because, after the bull market hit the crucial price level of $0.008 on June 20, it has maintained its movement within a narrow price range of $0.0076 and $0.0082. The support level within this price channel is becoming stronger, and it will form the basis for more upside action.
Key Levels
- Resistance: $0.015, $0.016, and $0.017
- Support: $0.007, $0.006, and $0.005.

Dash 2 Trade (D2TUSD) Price Analysis: The Indicators’ Point of View
Although since June 20, the Dash 2 Trade market has been at equilibrium. It has seen more swing highs than swing lows, showing that bulls have the upper hand. If buyers can keep the market from falling out of the current narrow price range, they will eventually wear out bearish sentiments.
Unlike Bollinger Bands and the Relative Strength Index (RSI), The Moving Average Convergence and Divergence (MACD) still slightly portrays the bulls having the upper hand, as the two MACD lines remain above level zero. But more is expected from the bulls to propel the market in a bullish direction.

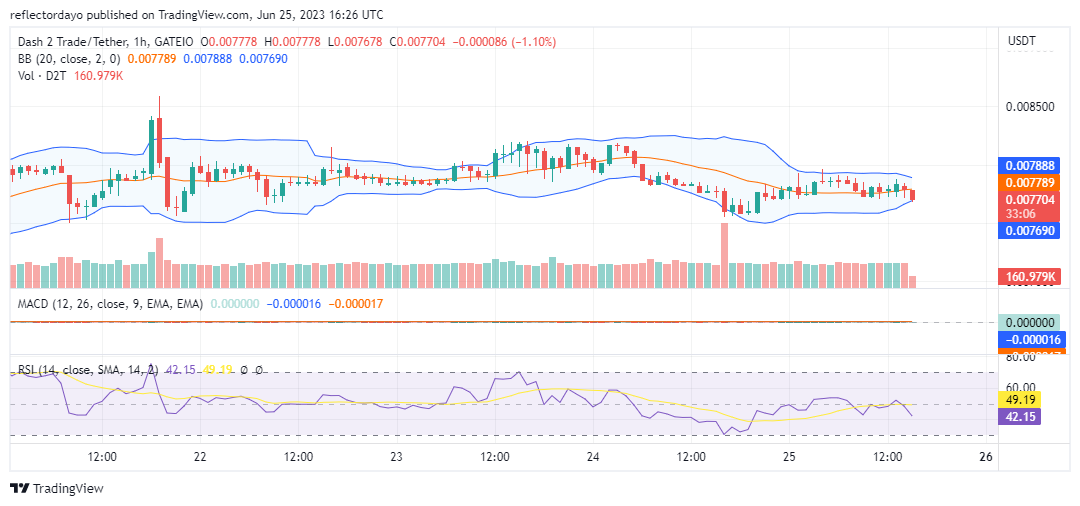
D2T/USD Short-Term Outlook: 1-Hour Chart
From this point of view, the price channel, as illustrated by the Bollinger Bands indicator, is now below the $0.008 price level. But the price action continues to maintain movement along with the 20-day moving average. Both market forces have become evenly matched for the time being.
Also, the low volume of trade could be a contributing factor to the indecision in the market. Already, the D2T market is set for upside action, but more bulls are needed to break out of the deadlock.
The D2T Backtester is so useful.
New Video: Backtesters at Dash2Trade, why are they so useful? Dive in!https://t.co/B3ys3KaB0w
— Dash 2 Trade (@dash2_trade) June 24, 2023
Do you want a coin with great potential for enormous returns? Dash 2 Trade (D2T) is that coin. Buy D2T now!


Leave a Reply