Tamadoge Price Prediction – July 5
There has been a long-held trade stance portending that the TAMA/USD market would get repositioned southward, as it has been demonstrated that the crypto-economic market has been moving to optimal lows, bracing for ups.
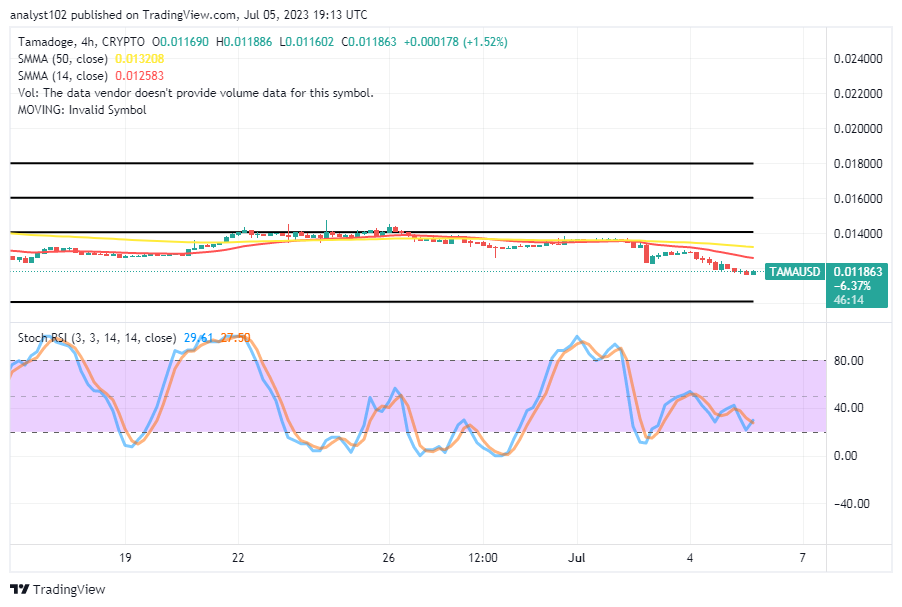
Over time, it has showcased on the long-term indicator that the velocity to the upside has a lengthy weight to push through some support layers as it made trade spots embodied by a high and a low value point of $0.011886 and $0.011602 at a minute 1.52% that is gradually turning into higher positives. The current declination process should be seen as a window of opportunity to continue to add to the size of portfolios.
TAMA/USD Market
Key Levels
Resistance levels: $0.01300, $0.01400, $0.01500
Support levels: $0.01100, $0.01000, $0.00900
TAMA/USD – 4-hour Chart
The TAMA/USD 4-hour chart shows that the crypto-economic market moves to optimal lows, bracing for ups from around the logical trade line of $0.01200.
The 50-day SMA indicator is trending at $0.013208 above the $0.012583 of the 14-day SMA indicator. The Stochastic oscillators first traversed southbound to touch an area of 20 before attempting to swing back northbound, placing 27.50 to 29.61. A 4-hour trading candlestick is in the making to represent a bullish moment in crypto business transactions.
Should the TAMA/USD market long-position takers shift their limit buying orders to a lower line around $0.01100?
Currently, there has been a chain of variant dipping processes in the Tamadoge market against the US currency as the crypto trade is expected to be bracing for ups to recover some lost momentum.
The devaluation-moving course enjoyed by bears in the market is liable to a situational risk of getting trapped if a sudden bounce resumes, especially against the trend line of the smaller SMA. In the meantime, investors and buyers should doubt that a rebound won’t come afterward. It is only in the womb of time that it is not too far.
TAMA/USD 1-hour chart
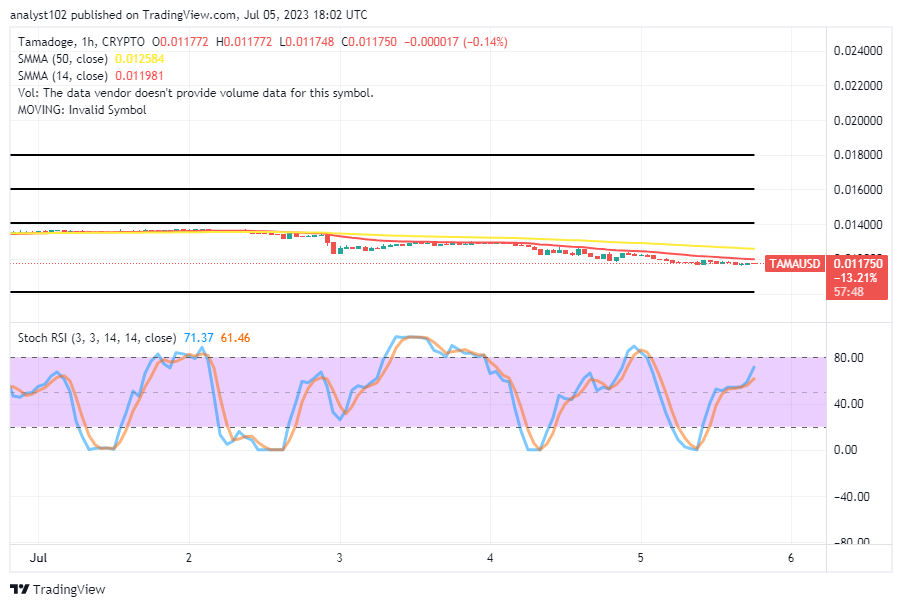
The 1-hour chart reveals that the crypto market moves to optimal lows, bracing for ups closely beneath the path of the smaller SMA.
The 14-day SMA indicator is at $0.011981, one point below the $0.012584 figure of the 50-day SMA indicator. Forces going back to the upside have to contend with the breaking of barriers around the smaller point of the indicator. The Stochastic Oscillators have stretched northbound from 61.46 to 71.37 levels. Long-position takers might not be seeing a rush of increments in their valuation positions.
Does anyone know which venture our feisty lil’ Tamadoge is on in this screenshot?
Anyone know which adventure our feisty lil’ Tamadoge is on in this screenshot?
— TAMADOGE (@Tamadogecoin) July 6, 2023
Drop the name of the game in the comments! 🏜️ pic.twitter.com/YFc1KNSanR
Do you want a coin that would 100X in the next few months? That is Tamadoge. Buy TAMA today
Note: Forexschoolonline.com is not a financial advisor. Do your research before investing your funds in any financial asset or presented product or event. We are not responsible for your investing results.


Leave a Reply