Tamadoge Price Prediction – July 7
The purchasing power in the US economy has been steadily and slowly running over the worth of the Tamadoge to a lower significant spot that has made it to obtain a base, trying to rally back into a provident moment of increases afterward.
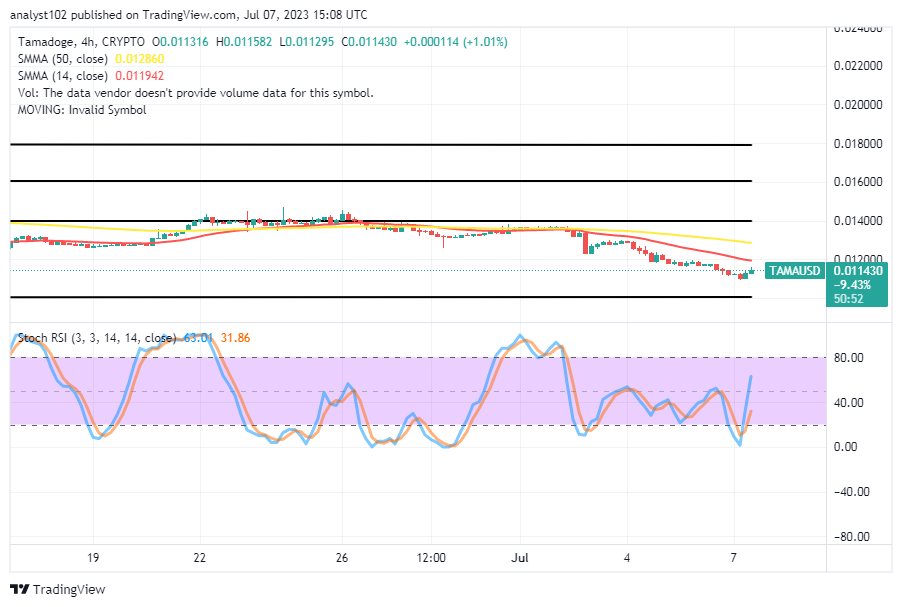
While that bias in the technical mind is on hold, buyers’ activities have begun to show positive signs, putting a percentage rate of 1.01 within the trade value lines of $0.011582 and $0.011295. The sloping path has remained impenetrable to northward penetration by strong barriers. And as a result, aspirations for new investors to take advantage of the current favorable reduced-rate buying periods continue to rise.
TAMA/USD Market
Key Levels
Resistance levels: $0.01300, $0.01400, $0.01500
Support levels: $0.01100, $0.01000, $0.00900
TAMA/USD – 4-hour Chart
The TAMA/USD 4-hour chart reveals that the crypto-economic market has seen a base and is trying to rally from around the $0.01100 support line.
The 50-day SMA indicator is around $0.012860 above the $0.011942 values of the 50-day SMA indicator. About two 4-hour candlesticks have formed, turning bullishly toward the smaller Moving Average’s point to signify that sellers are gradually losing strength. The Stochastic Oscillators have swerved northbound from the oversold region to keep between the levels of 31.86 and 63.01.
Where are the current obstacles to the TAMA’s valuation rising higher against the US coin?
The medium-term run outlook of the Tamadoge market against the US currency has portended a near-challenging trade around the 14-day SMA as the crypto business has seen a base, trying to rally from a lower spot of $0.01100 recently.
It could as well be projected that price is currently intending to push for a touch of resistance around the smaller indicator or between it and the higher SMA before shifting back to the South side for a formidable building of a baseline that would require some days before rebounding back through resistances afterward. It is that the base point may continually witness a rebuilding process around or between $0.01100 and $0.01000 in the long run.
TAMA/USD 1-hour chart
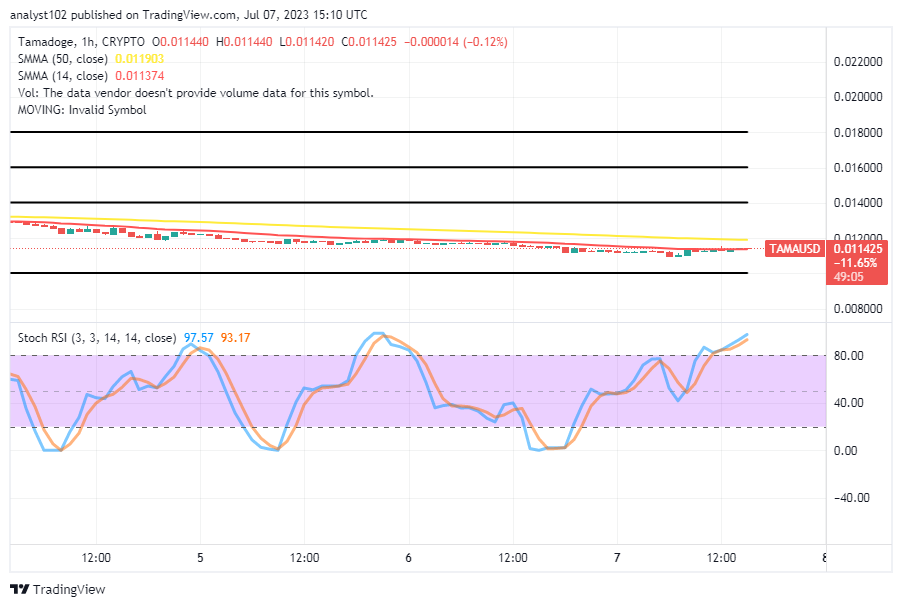
The 1-hour chart reveals the crypto price has seen a base, trying to rally from a lower point around the support line of $0.01100 against the smaller SMA.
The positioning of the Stochastic Oscillators in the overbought region from 93.17 to 97.57 levels portends that the possibility to push further northward sustainably is heading toward a stop. Likely, the placement pattern of the 14-day SMA at $0.011374 below the $0.011903 of the 50-day SMA suggests that a declining point has been quickly approached In conclusion; bulls should exercise caution when initiating new entries. It is still a zone for commerce, ideally with more orders.
Has Tamadoge ever been cuter in your life?
Although, when given the proper power-ups to rule the leaderboards, their bark is just as deadly as their bite.
Watch for additional developments as we get on with our construction!
✨FIRST LOOK AT OUR NEW 3D NFTs✨
— TAMADOGE (@Tamadogecoin) July 7, 2023
Have you ever seen a cuter Tamadoge in your life??
Beware though… their bark is just as lethal as their bite when equipped with the right power-ups to dominate the leaderboards 💪🏼😏
Keep an eye out for more progress as we continue to build! pic.twitter.com/InPo2TvpPZ
Do you want a coin that would 100X in the next few months? That is Tamadoge. Buy TAMA today
Note: Forexschoolonline.com is not a financial advisor. Do your research before investing your funds in any financial asset or presented product or event. We are not responsible for your investing results.


Leave a Reply