Tamadoge Price Prediction – May 28
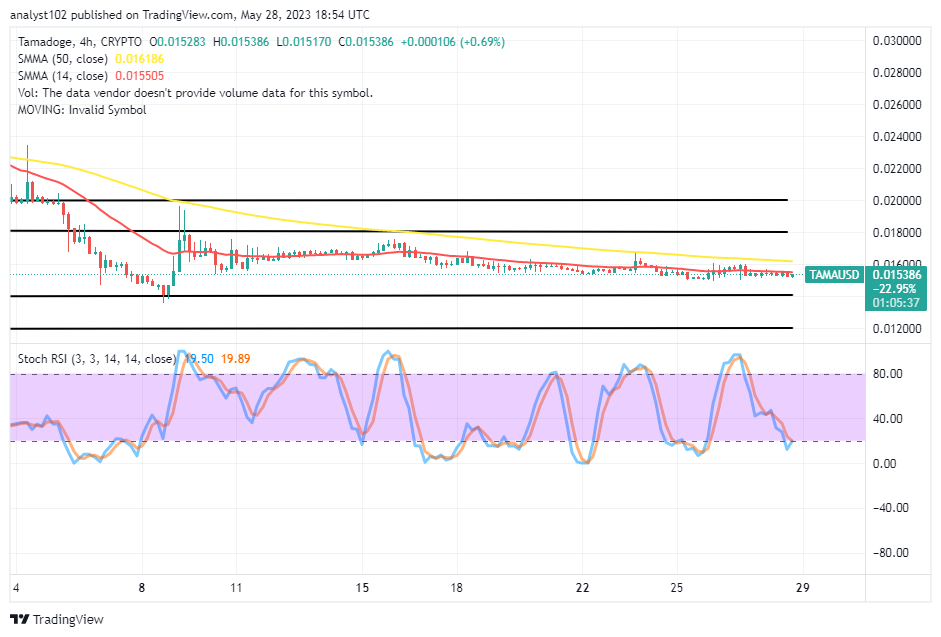
Indications are showing to buttress the TAMA/USD markets to hold positions in promissory ups as the crypto-economic valuation remains difficult to breach southward the $0.01400 support line. As of the technical trade writing piece of this write-up, bulls are maintaining the same point of high and the current trading figure of $0.015386, while the low line is at $0.015170. The percentage of 0.69 positive represents the rate of weight to the north side. That is to consolidate the stances of keeping the hope against seeing steadily bearish motions away from its present trading spot.
TAMA/USD Market
Key Levels
Resistance levels: $0.01750, $0.01850, $0.01950
Support levels: $0.01400, $0.01300, $0.01200
TAMA/USD – 4-hour Chart
The TAMA/USD 4-hour chart reveals that crypto-economic markets hold positions in promissory ups. Over time, it is possible to view indicators surrounding the trading area that the price has been emphasizing. Above the 14-day SMA trend line, at $0.015505, lies the 50-day SMA trend line. The Stochastic Oscillators have crossed southbound into the oversold region, keeping 19.50 to 19.89 levels. That implies a light positive trading session is in the offing.
Will the TAMA/USD market bears hold back the price to the zone of $0.01400 in the long run?
The expectation of pushing the Tamadoge price down to the $0.01400 support line against the US coin has been reducing as the crypto-economic markets hold positions in promissory ups. Even if the trade tends to shift suddenly at any point through the $0.01500 support will potentially reclaim a bounce. In the meantime, long-position placers still have a better chance to make buys into the economy of the cryptocurrency. Investors could continue to add more to their investment portfolios.
TAMA/USD 1-hour chart
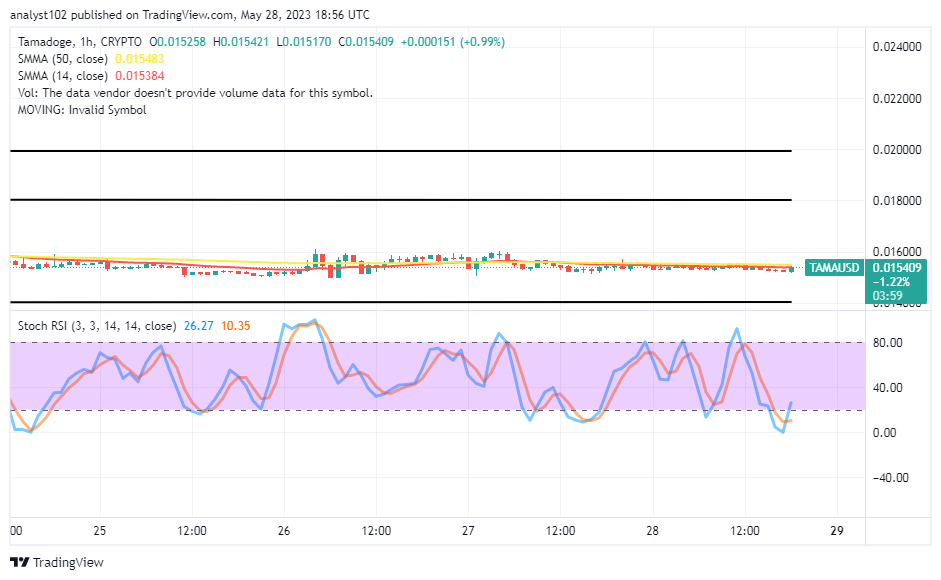
The 1-hour chart showcases the crypto-economic markets holding positions in promissory ups around the eastward conjoined trend lines of the indicators. Categorically taking the indicators’ points, the 14-day SMA trend line is at $0.015384, underneath the $0.015483 value of the 50-day SMA trend line. The Stochastic Oscillators are attempting to cross back northward at levels between 10.35 and 26.27 while they are in the oversold region. The position of the oscillators indicates that it would be advisable to put a buy position order.
Forget about Babydoge, TAMA is winning! In the coming days, it will be listed on top CEXs.
Do you want a coin that would 100X in the next few months? That is Tamadoge. Buy TAMA today
Note: Forexschoolonline.com is not a financial advisor. Do your research before investing your funds in any financial asset or presented product or event. We are not responsible for your investing results.


Leave a Reply