Tamadoge Price Prediction – October 13
It has been that the suspension of the buying spree has come to play out in the exchange process of Tamadoge versus the US currency, leading to a financial trade situation that makes the crypto-economic trades lower, obtaining a spring index.
The last few hours have seen a setback since the medium-term chart warned earlier in the day that the market was at risk of falling instead of continuing to rise and breaking through resistances up to the value of $0.008500. Even when more lows tend to appear in the current transaction order, purchasing positions are often encouraged to get better and better.
TAMA/USD Market
Key Levels
Resistance levels: $0.008500, $0.009000, $0.009500
Support levels: $0.007500, $0.007000, $0.006500
TAMA/USD Medium-term Chart
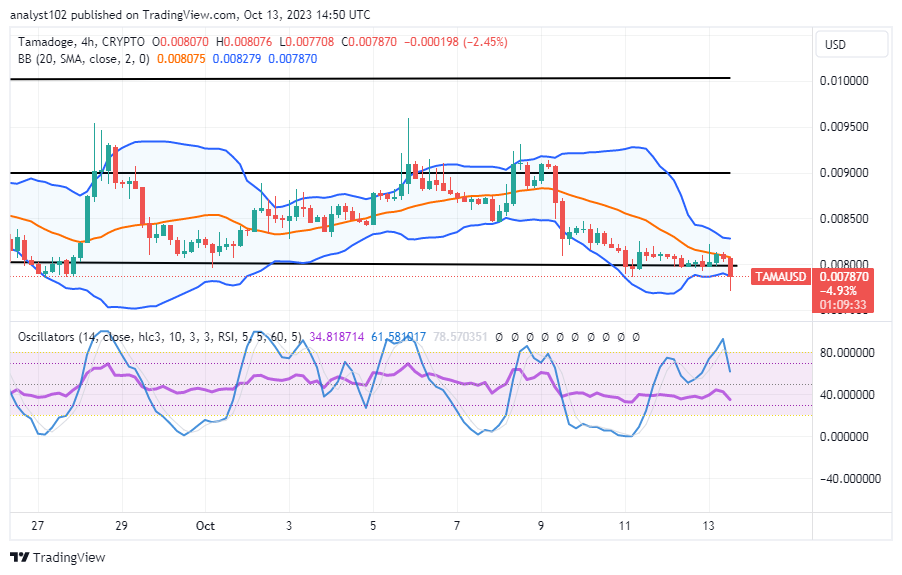
The TAMA/USD medium-term chart reveals the crypto trades lower at the critical point of $0.00800, obtaining a spring from underneath the lower Bollinger Band trend line.
The Bollinger Band trend lines are situated in the order of $0.008279, $0.008075, and $0.007870. As of the time of this technical piece, it showcases that the current trade point is at $0.007870, maintaining a negative percentage rate of 2.45. The stochastic oscillators are in a position of crossing southward, keeping from 61.581017 to 34.818714 values.
As TAMA has drifted lower in relation to the value of the US coin, can there be further lows below the support of $0.007500?
As there has been a situation showcasing that the TAMA/USD market has moved against the north from the point of $0.008000, furthering of low motions below that point won’t maintain stable positions as the trades lower, obtaining a spring alongside the forces.
For long-position takers to start buying during an aggressive decline in the value of the cryptocurrency economy, it would be highly technical. Before selecting when to execute a purchase order, northward market movers should consider the stochastic oscillator reading critically while it is in the oversold region or lower points. Investors, however, are not required to act in that order because they are free to increase their stake from the current point of trade.
TAMA/USD Short-term chart
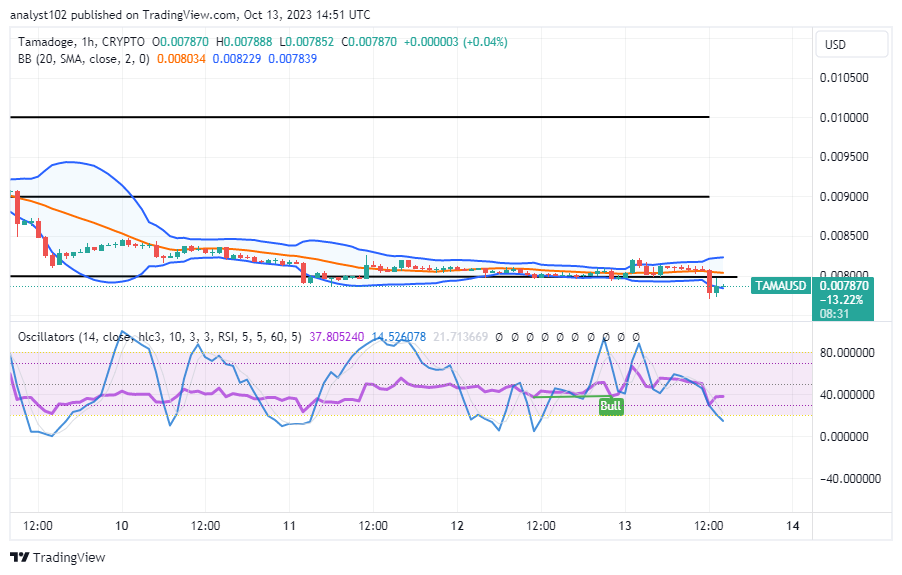
The TAMA/USD short-term chart exposes the crypto-economic trades lower around the line of $0.008000, obtaining a spring from the lower Bollinger Band trend line.
The upper Bollinger Band is at $0.008229, the middle part is at $0.008034, and the lower Bollinger Band is at $0.007839. The stochastic oscillators have moved from 37.805240 to 14.526078 in a southerly direction. A line drop may be emerging at this time to indicate that buyers may still need to exercise some patience before recovering solid positions.
The first mega-burn will take place in October, and more burning will occur in November and December.
The Burning Portal allows you to monitor all TAMA by the project and the community.
Tamadoge Mega Burns 🔥
— TAMADOGE (@Tamadogecoin) October 13, 2023
1st Mega Burn is coming up in October and we’re burning even more November & December too 💪
You can keep an eye on all $TAMA burnt by the project and the community at the Burn Portal 👉https://t.co/CweV78gM4h pic.twitter.com/IP5bW0VuyI
Do you want a coin that would 100X in the next few months? That is Tamadoge. Buy TAMA today
Note:Forexschoolonline.com is not a financial advisor. Do your research before investing your funds in any financial asset or presented product or event. We are not responsible for your investing results.


Leave a Reply