Tamadoge Price Prediction – September 17
A lot of activities have been slowly and systemically emanating from the market exchanging processes that have been taking place between Tamadoge and the US Dollar, showcasing that the crypto-economic trades go underpriced against the valuation of the fiat currency, posing hikes toward finding support.
Currently, it appears from the technical concepts that the forces supporting the motion on the south side are moving more quickly to prevent receiving an early return on the opposite side. On the off chance that assumption is incorrect, it would still be a good idea for long-position traders and investors to constantly adopt the mindset of buying during a dip.
TAMA/USD Market
Key Levels
Resistance levels: $0.01000, $0.01100, $0.01200
Support levels: $0.008500, $0.07500, $0.06500
TAMA/USD Medium-term Chart
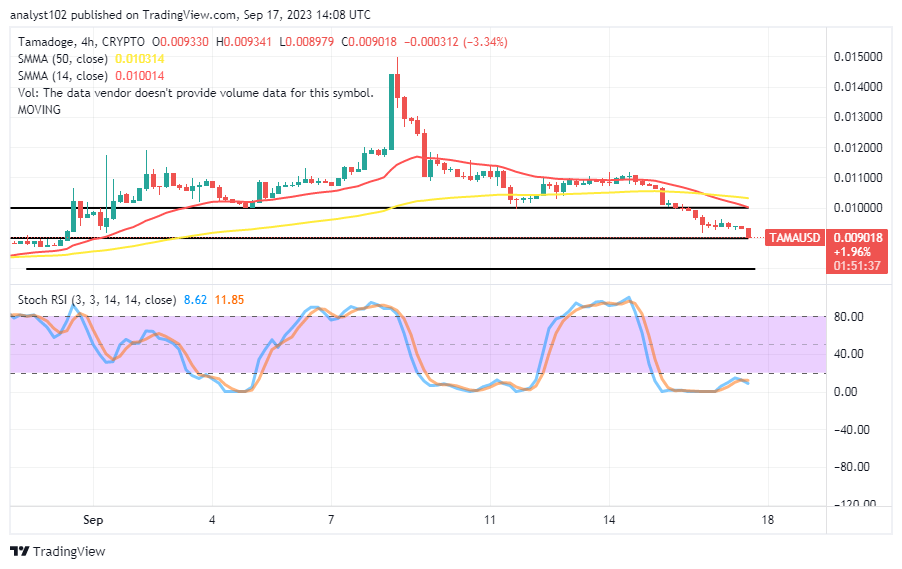
The TAMA/USD medium-term chart showcases how crypto-economic trades go underpriced against the marketing worth of the American currency, posing a hike outlook that could surface in no time.
The 14-day SMA trend line eventually intercepted the 50-day SMA trend line to produce points between $0.010314 and $0.010014. The Stochastic Oscillators are dipping into the oversold region to stay between 11.85 and 8.62.
Will there be moves down in the TAMA/USD market after the most recent low of $0.006?
As it has been demonstrated that a downward consolidation movement is ongoing on a gradual moving basis, it appears not glaring that sellers will be having a decent entry even though the TAMA/USD trades go underpriced, posing hikes.
The current movements, which reveal a series of devaluations, should be viewed as a window of opportunity for quickly securing a buying cycle. Given the current situation, a fearful breakdown of the line at $0.00900 will result in support being found among the defined lines mentioned above. To indicate the probability of observing the desired order during the process, a bullish candlestick is required.
TAMA/USD Short-term chart
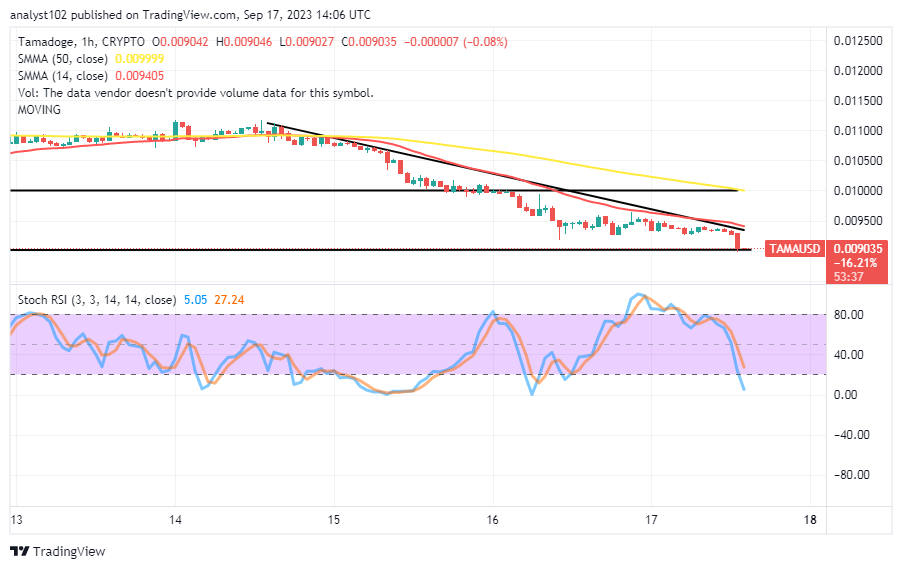
The TAMA/USD short-term chart reveals that the crypto trades go underpriced versus the trading weight of the US coin, posing hikes even in the course of that.
The 50-day SMA indicator is around $0.01000, which puts it above the 14-day SMA indicator’s value of 0.009405. The bearish trend line has been drawn in backup mode alongside the smaller moving average. As of the writing of this article, the stochastic oscillators have crossed southward and are now located between 27.24 and 5.05. A bullish candlestick that regularly bottoms out at a lower trading zone on a daily chart will indicate a solid upward trend.
With each game you play, the new Tamadoge NFTs get better. They will gain experience, acquire accessories, and become rarer.
The new Tamadoge NFTs improve as you play our games. Level them up, add accessories and boost their rarity 💎
— TAMADOGE (@Tamadogecoin) September 17, 2023
Check out the NFT sale here 👉 https://t.co/RsO9wT8zpR pic.twitter.com/wk4MDlgRex
Do you want a coin that would 100X in the next few months? That is Tamadoge. Buy TAMA today
Note:Forexschoolonline.com is not a financial advisor. Do your research before investing your funds in any financial asset or presented product or event. We are not responsible for your investing results.


Leave a Reply