Tamadoge Price Prediction – September 15
A repositioning of stances has been in the process against the valuation of the Tamadoge pairing with the market worth of the US Dollar, given that crypto-economic trade turns lowly as it fails to push through significant resistances away from $0.01100, given that it is again setting for hikes.
To put it another way, a series of corrections have begun to dominate in the TAMA/USD market operation to project another lower trade stance that could lead to the rebuilding of a formidable foothold that long-position takers will wage rises from in the near future. This is because a technical peep result from a daily trade chart indicates that a velocity pace has been placed on a spot that could negate getting reliable further free fall-offs. In light of that, purchasing habits appear to be of the highest caliber.
TAMA/USD Market
Key Levels
Resistance levels: $0.01200, $0.01250, $0.01300
Support levels: $0.009500, $0.009000, $0.008500
TAMA/USD Medium-term Chart
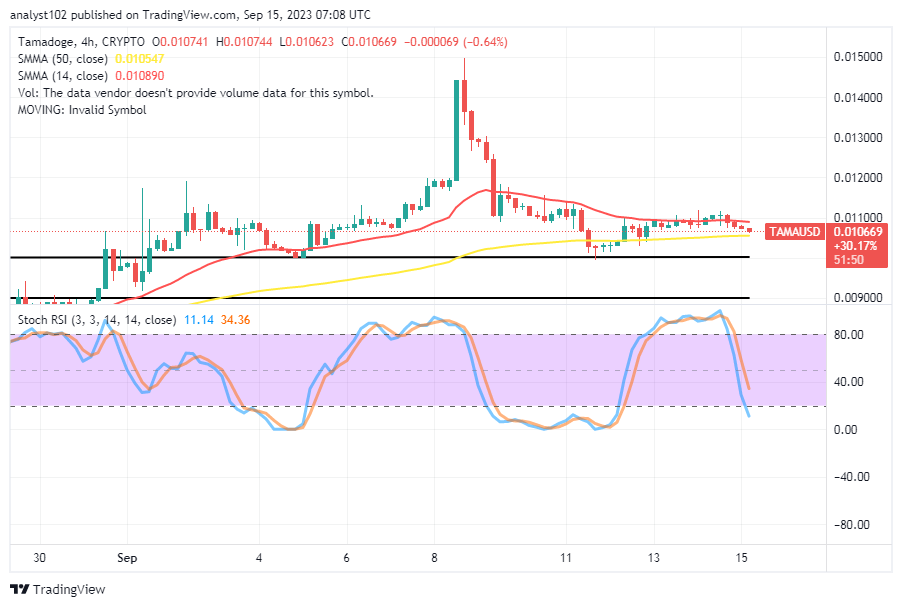
The TAMA/USD medium-term chart showcases the crypto trade turning lowly, following its inability to surge higher through resistances above the last high point it obtained earlier, as it is also believed to be setting for hikes in the near future.
Price actions in the market have made the 14-day SMA trend line position at $0.010890 above the $0.010547 value line of the 50-day SMA trend line. The stochastic oscillators have crossed southbound from the overbought region to positions from 34.36 to 11.14, raising an alarm situation toward seeing a stance to douse the effect of a selling move.
Will the market for TAMA/USD’s underlying supports between $0.010 and $0.0090 withstand unwarranted falls?
Our psychological optimism in the wake of business operations in the TAMA/USD market still stays unshakeable as regards the support points between $0.01000 and $0.009000, given that the crypto trade turns lowly as of the time of this piece, setting for hikes.
Currently, the weight of the downward gravitational force lacks the ability to maintain its position for a longer period of time before giving way to an upward index. According to that attitude, investors are urged to proactively take control of their positions by increasing their equity holdings. 
TAMA/USD Short-term chart
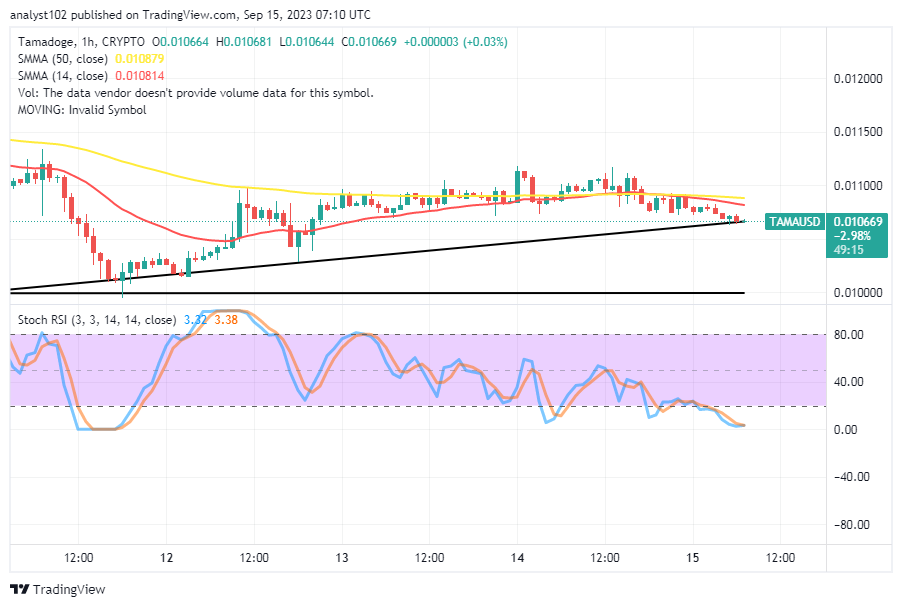
The TAMA/USD short-term chart reveals that the crypto-economic trade turns lowly on a gradual moving style, setting for hikes.
The 14-day SMA indicator has briefly intercepted the 50-day SMA indicator to the downside. As it is about to break, the bullish trend line has been in a depression. The stochastic oscillators are now positioned between 3.38 and 3.32 after steadily moving southward into the oversold area. Buyers are anticipated to use this tactic to enter positions before rebounds.
Grab your playable NFTs right away as we get ready for an update that will revolutionize the Tamaverse soon. (https://t.co/RsO9wT8zpR) https://nfts.tamadoge.io
Game in style with the new Tamadoge NFTs 🎩
— TAMADOGE (@Tamadogecoin) September 14, 2023
Grab your playable NFTs now as we prepare for a game changing update coming to the Tamaverse soon
Do you want a coin that would 100X in the next few months? That is Tamadoge. Buy TAMA today
Note:Forexschoolonline.com is not a financial advisor. Do your research before investing your funds in any financial asset or presented product or event. We are not responsible for your investing results.


Leave a Reply