Tamadoge Price Prediction, February 12
In the process of being firmly positive against most negative moves in the display of Tamadoge market operations versus the US coin, it seems to be holding a promissory crypto signal to the upside, as the present financial situation shows that trade surges higher, aiming to stay afloat.
As things currently stand, a series of erratic movements have been progressively inverted to leave a growing setup on the $0.005 thresholds, with the point of $0.004 acting as a backup in the event of a protracted run. Presntly, northward pushes are reintegrating increasingly into stable recovery stages.
TAMA/USD Market
Key Levels
Resistance levels: $0.0070, $0.0080, $0.0090
Support levels: $0.0040, $0.0030, $0.0020
TAMA/USD Medium-term Chart
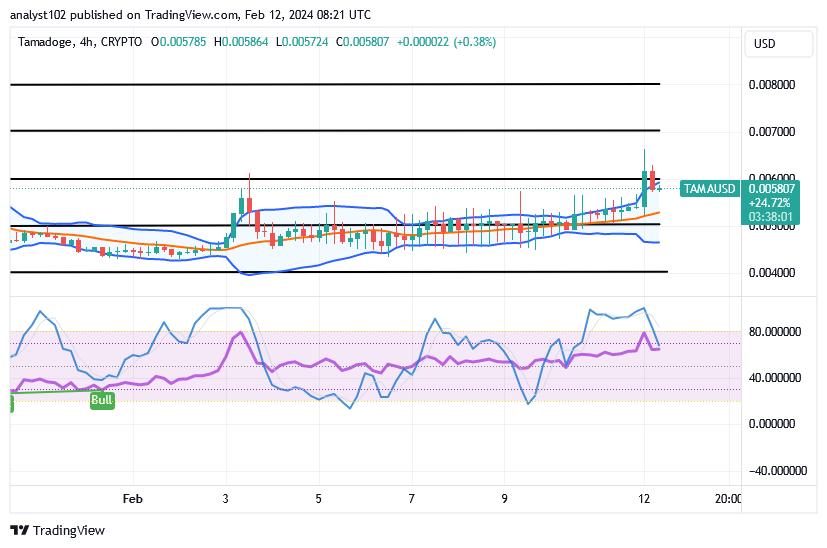
The TAMA/USD medium-term chart showcases the crypto-economic trade surges toward the value of $0.007, aiming to stay afloat above $0.004.
The Bollinger Band trend lines are slowly changing upward, staging around the points of $0.006 and $0.004. As of the time of this write-up, the middle Bollinger Band indicator is now serving as the main underlying support of $0.005. The stochastic oscillators have been demonstrating a mode of swerving to denote that most subsequent moves are going to upkeep rises.
What level of stability must the TAMA/USD market maintain now that the price has made an upsurge?
The vital baseline that the TAMA/USD trade should be wary of is showcased around the zone of the middle Bollinger Band. And the main value is set around the value of $0.005, given that the price surges, aiming to stay afloat.
When the price tends to draw back toward the middle Bollinger and the lower Bollinger Band trend lines, the indicators are arranged in a way that highlights the entry point. The main trading conclusion is that more lengthy position openings should be followed because moves to regain momentum will occur at places between $0.005 and $0.004.
TAMA/USD short-term chart
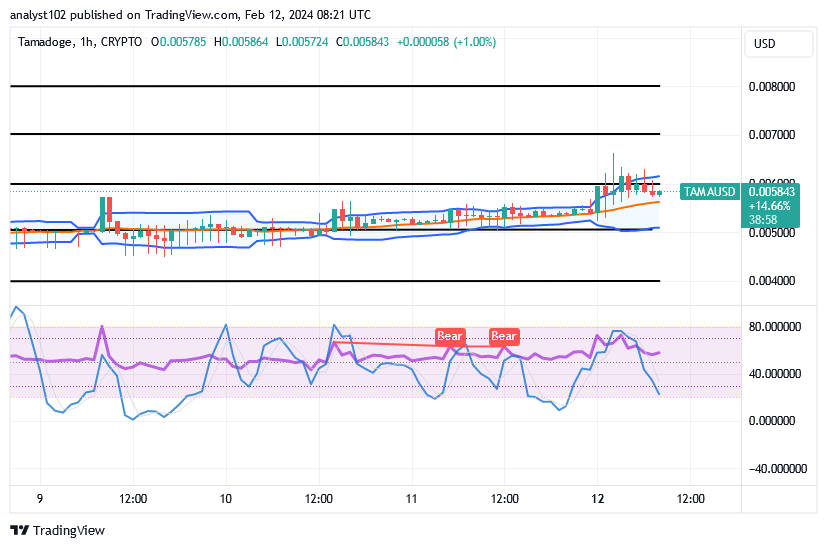
The TAMA/USD short-term chart reveals that the crypto-economic trade surges, aiming to stay afloat above the spot of $0.005.
The blue line has been set in close proximity to the oversold region by placing the stochastic oscillators at an angle determined by hourly analytics. There is a minor bullish candlestick forming, suggesting that there is an opportunity for new buyers. The Bollinger Bands are lining up slightly to the north, indicating that the movement tendency is increasing. As a result, desiring positions should be pursued more than sales considerations.
Play, earn, risk, and repeat to take advantage of an endless loop of pleasure and advantages.
Dive into the world of Tamadoge games and watch your $TAMA earnings grow!
— TAMADOGE (@Tamadogecoin) January 16, 2024
Play, earn, stake, and repeat for an endless cycle of excitement and rewards 🎉
Check out all of our games on mobile now 👇
📱 Android: https://t.co/D4TjX7gTFl
📱 iOS: https://t.co/0fjJapf5oA pic.twitter.com/7QrRJ2V98s
Do you want a coin that would 100X in the next few months? That is Tamadoge. Buy TAMA today
Note: Forexschoolonline.com is not a financial advisor. Do your research before investing your funds in any financial asset or presented product or event. We are not responsible for your investing results.


Leave a Reply