Tamadoge Price Prediction, February 16
As there has been a long-range line of sideways movement in the production of ups and downs that have featured between Tamadoge and the valuation of the US coin, the situation presently shows that the crypto economy stays positive above the point of $0.004, inclining a spike.
As per the extensive technical analysis, the market line centered around $0.005 seems to be a crucial place at which investors should contemplate expanding their holdings prior to the emergence of consistent upward trends. To determine the best timing to place purchase orders, it also makes sense to follow the repositioning creation of the stochastic oscillators at lower zones based on the daily chart basis.
TAMA/USD Market
Key Levels
Resistance levels: $0.0060, $0.0070, $0.0080
Support levels: $0.0040, $0.0030, $0.0020
TAMA/USD Medium-term Chart
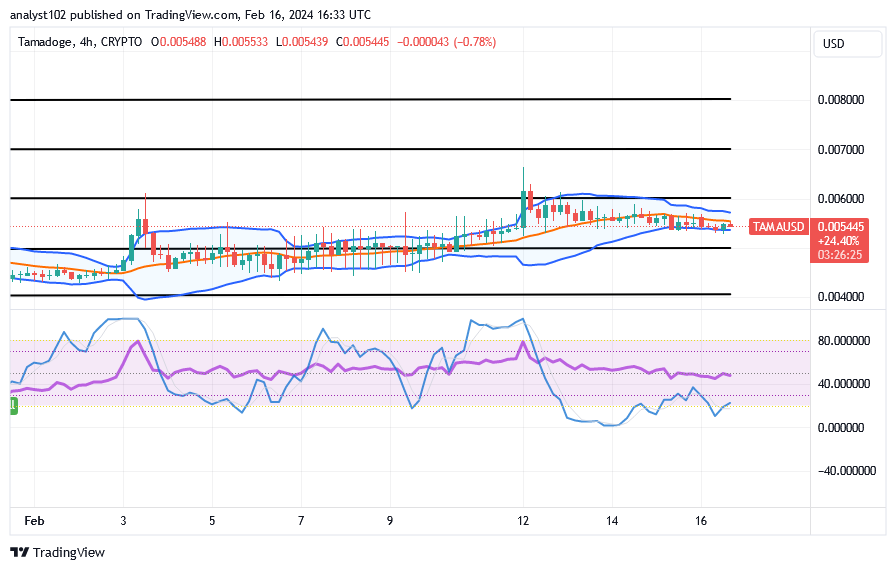
The TAMA/USD medium-term chart showcases the crypto market staying positive around the lower Bollinger Band trend line, inclining a spike input.
Variant 4-hour candlesticks have been systemically forming to portend that a slight downward curve is maintained across the space of the Bollinger Band indicators. The stochastic oscillators have traversed into the oversold region to deepen their stances in it.
How does the TAMA/USD market tend to be moving as it pushes down around the lower Bollinger Band indicator?
As it has been observed, the TAMA/USD trade is moving lowly around the spot of the lower Bollinger Band, showing that the price is not going to give in so much to bears because it stays positive above $0.004 over time, inclining a spike index.
The way things are, most phony pull-downs tend to gain back active moves in the opposite direction, so long-position pushers have to be alert for them. In order to offset the majority of the earlier, higher costs, we urge investors to keep working harder and adding more positions to their current portfolio volumes ahead of any possible rebounding force, which is likely to occur in no time.
TAMA/USD short-term chart
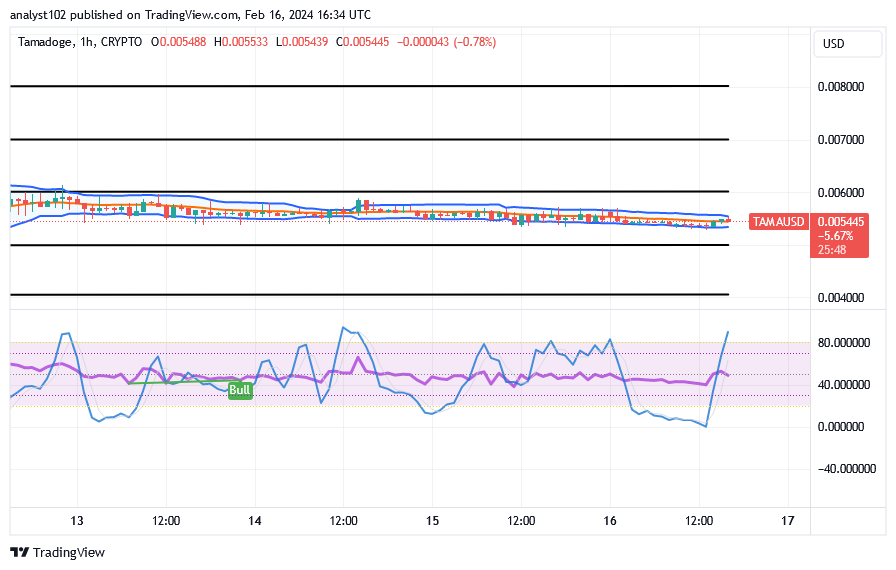
The TAMA/USD short-term chart reveals that the crypto-economic market stays positive in the Bollingr Band indicators, inclining a spike.
The blue part of the stochastic oscillators has slowly veered northward into the overbought area. For some sessions, the Bollinger Band trend lines have been firmly stretched on the range-bound axes of $0.006 and $0.005. As long as there is no scared pushback of the price in the longer-term trend to maintain a stable attitude, there are still open window possibilities to buy and stake holdings.
Get power-ups to accelerate through the park, onto the beach, and downtown.
Our new runner game Tamadoge Pursuit is coming soon 🎉
— TAMADOGE (@Tamadogecoin) January 18, 2024
Collect power ups to help you zoom downtown, through the park and onto the beach 🏖️😎
Launching on Android and iOS soon pic.twitter.com/C9mKnALPdQ
Do you want a coin that would 100X in the next few months? That is Tamadoge. Buy TAMA today
Note: Forexschoolonline.com is not a financial advisor. Do your research before investing your funds in any financial asset or presented product or event. We are not responsible for your investing results.


Leave a Reply