Tamadoge Price Prediction, January 10
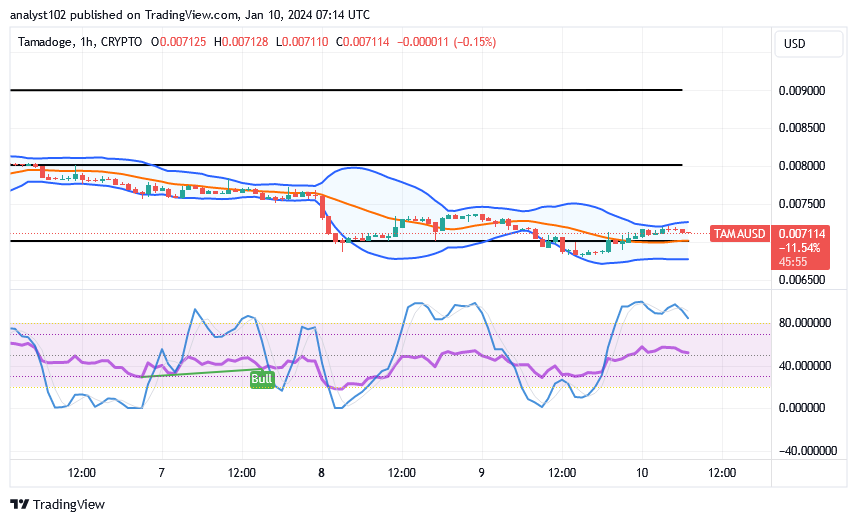
A downward trending path to the TAMA/USD market operations has been steadily maintained until now, as the crypto trade stays down, rearing a bounce index.
In order to ensure a favorable trading environment and assure price reduction, rebounding forces have been systemically delayed. The lower Bollinger Band trend line has been the route of shorting operations, which have been extending southerly to further delay upswinging forces. Determining the market impulse waves has been largely aided by the repositioning of the stochastic oscillator indicators.
TAMA/USD Market
Key Levels
Resistance levels: $0.0080, $0.0085, $0.0090
Support levels: $0.00700, $0.0065, $0.0060
TAMA/USD Medium-term Chart
The TAMA/USD medium-term chart showcases that the crypto-economic trade stays down, rearing the bounce index.
The Bollinger Band trend lines have remained slightly bending in the south direction in response to the falling pressures that the price has been showcasing. The stochastic oscillators have swerved back upside to position in the overbought region, portending a signal that the price can still go southerly with a smaller velocity.
Should long-term investors in the TAMA/USD market remain back as the trade features around $0.007119, despite the declining velocity?
The general prevalence of fall-offs in the operations of the TAMA/USD trade may still continue for a while, given that the crrypto trade stays down, rearing a bounce index.
A persistent forced move may discourage some impatient traders from taking on more buying positions because there is still room for price reductions. However, we advise that the procedure for securing positions be maintained positive in order to prevent any additional losses. The current downward trend makes choosing different investment levels technically ideal. As it stands, there is a small window of opportunity for craving trading myths to ultimately achieve enormous profits.
TAMA/USD short-term chart
The TAMA/USD short-term chart showcases the crypto-economic trade staying down, rearing the bounce index in the Bollinger Bands.
To maintain a running tally of the rate of decline, the Bollinger Band indicators are positioned just below the $0.0075 line.The stochastic oscillators show that the market is still primarily moving in a lower-low trade pattern, even if they are in the overbought area. Entrepreneurs shouldn’t abandon the effort to secure additional values.
A final reminder for this week’s rankings
Play any Tamadoge game to start earning TAMA right away.
🚨 Last call for this weeks leaderboard 🚨
— TAMADOGE (@Tamadogecoin) January 10, 2024
Get playing any Tamadoge game to earn your $TAMA now 👇
📱 Android: https://t.co/D4TjX7gTFl
📱 iOS: https://t.co/0fjJapf5oA pic.twitter.com/hXBC2PBebJ
Do you want a coin that would 100X in the next few months? That is Tamadoge. Buy TAMA today
Note:Forexschoolonline.com is not a financial advisor. Do your research before investing your funds in any financial asset or presented product or event. We are not responsible for your investing results.


Leave a Reply