Tamadoge Price Prediction – October 16
Lesser efforts have been maintained in the capacity of bulls to breach past the key resistance line of $0.00900 in the market activities of TAMA/USD, given that the crypto-economic trade springs up the points between $0.00800 and $0.007500, touching the higher point mentioned earlier.
Numerous sessions have emerged to demonstrate that a number of rejections have essentially been positioned around the decelerating line of $0.00900. Indications continue to point to the fact that price actions are still within the realm of restraint, leading consumers to believe that the practice of add-ons is an ideal practice that must be continued. As things stand, those who are taking long positions must continue to do so before the price starts to rapidly rise during operations that will take place in the future’s hidden aftermath.
TAMA/USD Market
Key Levels
Resistance levels: $0.009000, $0.009500, $0.01000
Support levels: $0.00800, $0.007500, $0.007000
TAMA/USD Medium-term Chart
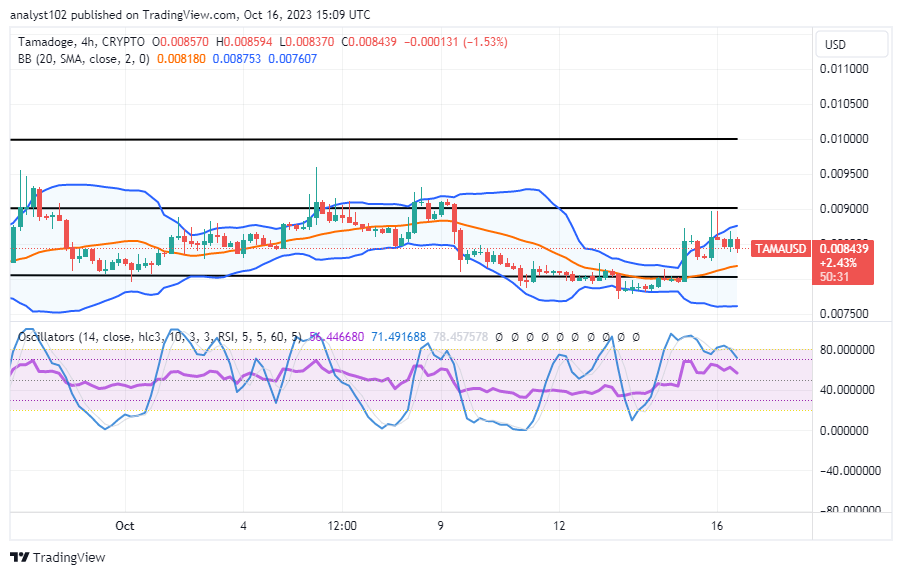
The TAMA/USD medium-term chart reveals that the crypto-economic trade springs up from a spot that was closely above the point of $0.007500 some days ago to touch the resistance line of $0.009000 before reverting a light correction against the upper Bollinger Band trend line.
The stochastic oscillators are positioned at 71.491688 and 56.446680, indicating that further forces to the upside are on the verge of losing strength gradually as a result of this technical analysis. The Bollinger Band trend lines are kept at $0.008753, $0.008180, and $0.007607 values. The emergence of 4-hour candlesticks has been duly representing environments against seeing smooth, free-buying moments.
What level of trade position capacity do the TAMA/USD bulls own at the current price of $0.008439?
As we have been hearing that the TAMA/USD trade has been facing rejections around the resistance of $0.009000 over time, it shows that several recuperation processes of energy will come up, given that the crypto-economic trade springs up from a lower zone, touching the value mentioned initially.
It is nevertheless clear that certain shorting index levels can be used to infer whether short-term and medium-term traders should take certain precautions before acting in the direction of an ascending trend. As a result, options with a long-term trading strategy would undoubtedly provide profitable, positive returns in the activities that followed.
TAMA/USD Short-term chart
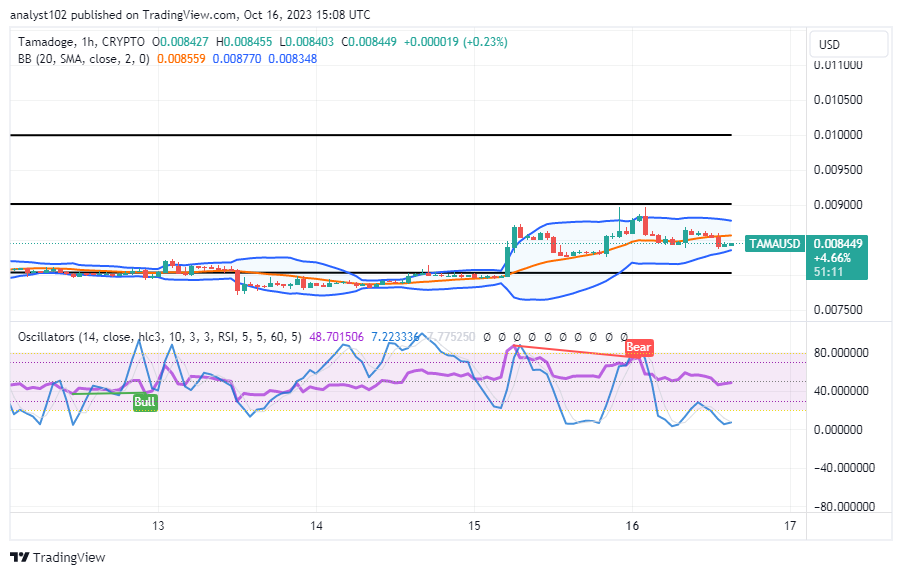
The TAMA/USD short-term chart showcases the crypto-economic trade springing up, touching the resistance line of $0.009000.
The stochastic oscillators have reached significant lower range trade points between 48.701506 and 7.223336, according to the indicators’ creation pattern. A stay is applied to the Bollinger Bands at $0.008770, $0.008559, and $0.008348. The current state of affairs suggests that selling orders won’t have the resilience to endure pressures greater than those that brought them to their most recent low level.
Kill the animals to advance on the leaderboard and collect
Time to play Tamadoge Arena 🐶
— TAMADOGE (@Tamadogecoin) October 16, 2023
Take down the critters, place on the leaderboard and earn $TAMA.
Download on mobile and play now 👇
📱 Android: https://t.co/INCaGendE4
📱 iOS: https://t.co/Fj9tT5Oicu pic.twitter.com/IcTe809Smc
Do you want a coin that would 100X in the next few months? That is Tamadoge. Buy TAMA today
Note:Forexschoolonline.com is not a financial advisor. Do your research before investing your funds in any financial asset or presented product or event. We are not responsible for your investing results.


Leave a Reply