Tamadoge Price Prediction – September 10
A series of notable corrections have prevailed in the transaction trade tract of Tamadoge in contrast to the US coin, which has presently resulted in the crypto-economic trade setting at $0.01100 and eyeing a hike.
The capacity of the depressive weight that has recently surfaced seems to have lost the desired motivation to prolong its stay over time by breaching lower lows. Given the current situation, holders of long positions should tighten their belts and place alternative purchase orders starting around the $0.01100 line, and if the price dips below that level, they shouldn’t be alarmed to continue holding long positions.
TAMA/USD Market
Key Levels
Resistance levels: $0.01200, $0.01250, $0.01300
Support levels: $0.01000, $0.009500, $0.009000
TAMA/USD Medium-term Chart
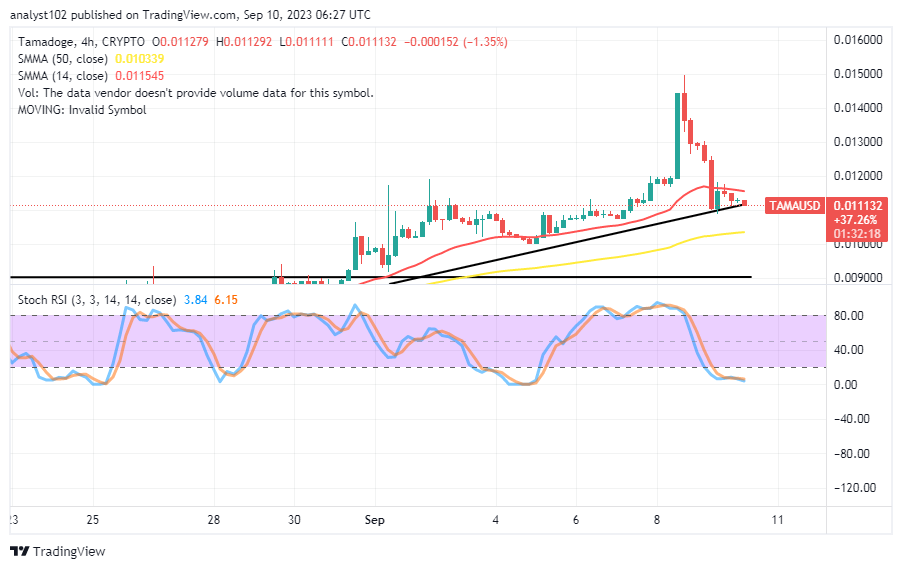
The TAMA/USD medium-term chart reveals that the crypto-economic trade is set at $0.01100, eyeing a hike.
The bullish trend line has been drawn in a supportive mode to the pathway the 14-day SMA indicator has been moving upside, positioning at $0.011545 above the $0.010339 value line of the 50-day SMA indicator. The Stochastic Oscillators have dipped into the oversold region, maintaining values from 6.15 to 3.84.
Will the TAMA/USD market breach the $0.012 resistance in the upcoming transactions?
The transaction barrier line that is tending to encounter the forthcoming rises remains at $0.01200, given that the TAMA/USD market sets on $0.01100, eyeing a hike from around the point of the bullish trend line drawn.
The debasement movement process appears to be slowing down at the present, either in forces around $0.01100 or in a possible extension of sinking toward a lower support line of $0.01000. The pedal for dropping pressure has been lowered to a certain degree. And even if the movements decline even further, less force will become active again to provide purchasers with leeway to continue their purchasing strategy. 
TAMA/USD Short-term chart
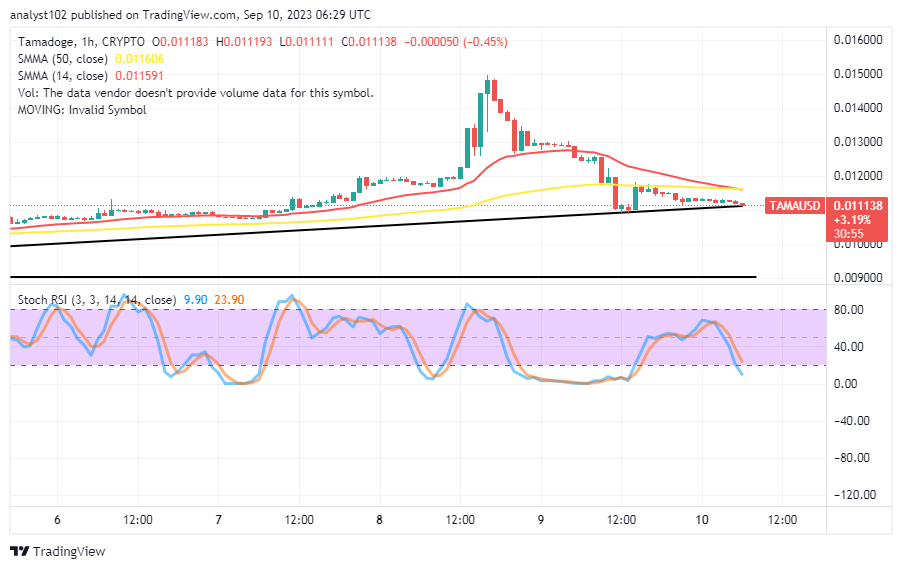
The TAMA/USD short-term chart reveals that the crypto trade is set at $0.01100, eyeing a hike from the bullish trend line drawn.
With marks of $0.011606 and $0.011591, the 50-day SMA trend line and the 14-day SMA trend line are converging at this moment. The stochastic oscillators have made a southerly crossover from values of 23.90 to 9.90. The smaller moving average’s position above its larger counterpart indicates that purchasers may need to exercise some patience, though it might not be necessary for several hours before mounting a recovery.
The arena is here. This weekend, take part in games and earn $TAMA (https://twitter.com/search?q=%24TAMA&src=cashtag_click) on Tamadoge Arena. Download now on your phone for Android:
The Arena Awaits ⚔️
— TAMADOGE (@Tamadogecoin) September 9, 2023
Play and earn your $TAMA on Tamadoge Arena this weekend. Download on mobile now 👇
📱 Android: https://t.co/INCaGendE4
📱 iOS: https://t.co/Fj9tT5Oicu pic.twitter.com/21lRFmVJa6
Do you want a coin that would 100X in the next few months? That is Tamadoge. Buy TAMA today
Note:Forexschoolonline.com is not a financial advisor. Do your research before investing your funds in any financial asset or presented product or event. We are not responsible for your investing results.


Leave a Reply