Tamadoge Price Prediction – September 12
In the wake of allowing a prolonged correction in the market arena by combining Tamadoge with the US currency, the financial transaction operation has led to the crypto-economic trade reversing, setting the stage for upswings once it finds an ideal foothold to commence.
In the interim, the market’s declining velocity might need to last for some time before a powerful transaction pattern reappears to provide a trustworthy up-stride index. While traders wait for that to happen, investors may have a different opinion and begin increasing the size of their portfolios in anticipation of any further dips before any potential bounce-offs that could occur at any moment.
TAMA/USD Market
Key Levels
Resistance levels: $0.01200, $0.01250, $0.01300
Support levels: $0.01000, $0.009500, $0.009000
TAMA/USD Medium-term Chart
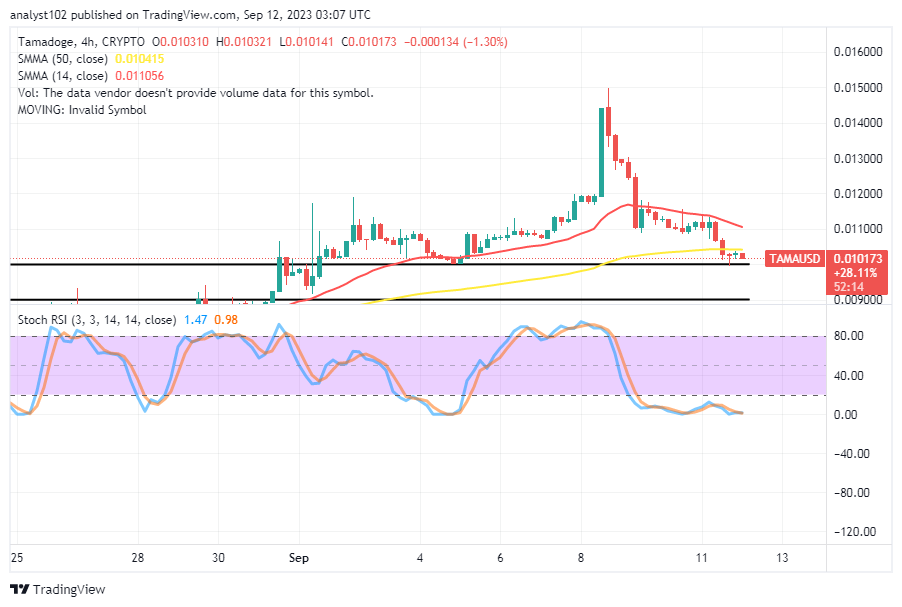
The TAMA/USD medium-term chart showcases the crypto market’s reverses, setting for upswings even though the price is yet to seize from moving through some supports to return to movements back to the upside.
The psychological trade values between the 14-day SMA indicator and the 50-day SMA indicator range from $0.011056 to $0.010415. The trading candlestick currently displays a negative price point of $0.010173 at a negative percentage rate of 1.30. The Stochastic Oscillators are in the oversold area and are moving in a consolidation pattern, which suggests that downward force is still, to some extent, the dominant trend.
What trade approach strategy is anticipated to preoccupy investors’ minds right now in the TAMA/USD market deals?
As there has been a return of reversal motion in the business line of Tamadoge against the US Dollar, it is likely that energy will be mustered from a lower-trading spot as the crypto economy reverses, setting the stage for upswings.
The current business climate hasn’t produced a negative attitude to halt the persistence of the drop. Nevertheless, buyers should be on the lookout for a comeback signal that will be generated with a bullish candlestick wall to play along with later. The general conclusion regarding this developing crypto economy is that investors should never sell their positions in a panic at any moment.
TAMA/USD Short-term chart
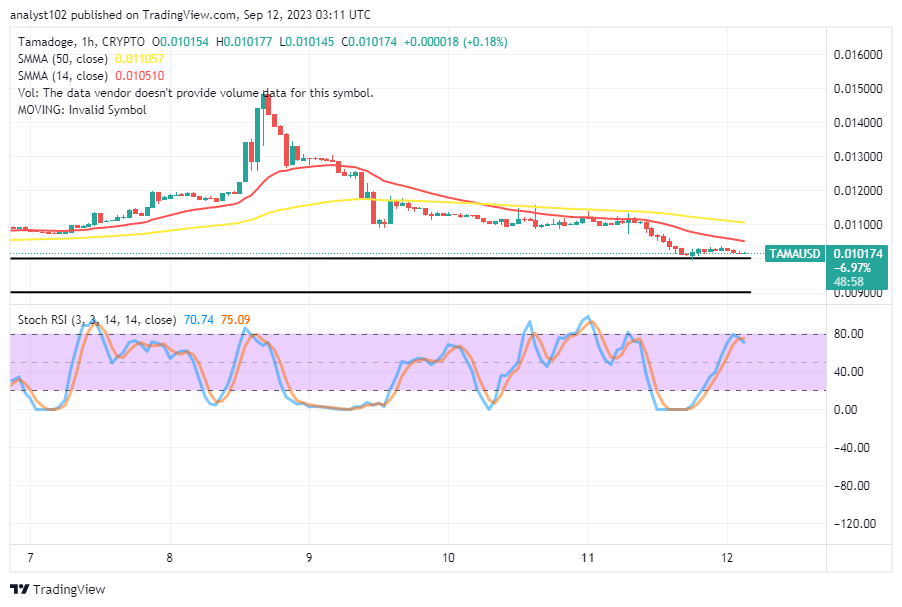
The TAMA/USD short-term chart reveals that the crypto-economic market reverses, setting the stage for upswings.
As the 50-day SMA trend line is positioned above the candlesticks, the 14-day SMA trend line has been holding a close touch there. The stochastic oscillators are closely following the 80-mile line as they march northward. However, they have barely crossed over to the south, moving from 75.09 to 70.74 values. At $0.01100, the main barrier line in the direction of the north is reachable.
Join the Tamadoge gaming pool right away.
Game for weekly $TAMA, stake for passive income 💪
— TAMADOGE (@Tamadogecoin) September 11, 2023
Join the Tamadoge staking pool today 👉 https://t.co/5JveDLtc69 pic.twitter.com/FX5qMyc82J
Do you want a coin that would 100X in the next few months? That is Tamadoge. Buy TAMA today
Note:Forexschoolonline.com is not a financial advisor. Do your research before investing your funds in any financial asset or presented product or event. We are not responsible for your investing results.


Leave a Reply