Tamadoge Price Prediction – October 18
Transactions of commercial operations involving market-pushing activities in the TAMA/USD, given that the cryptoeconomic trade retraces, rising above the base price of $0.0075.
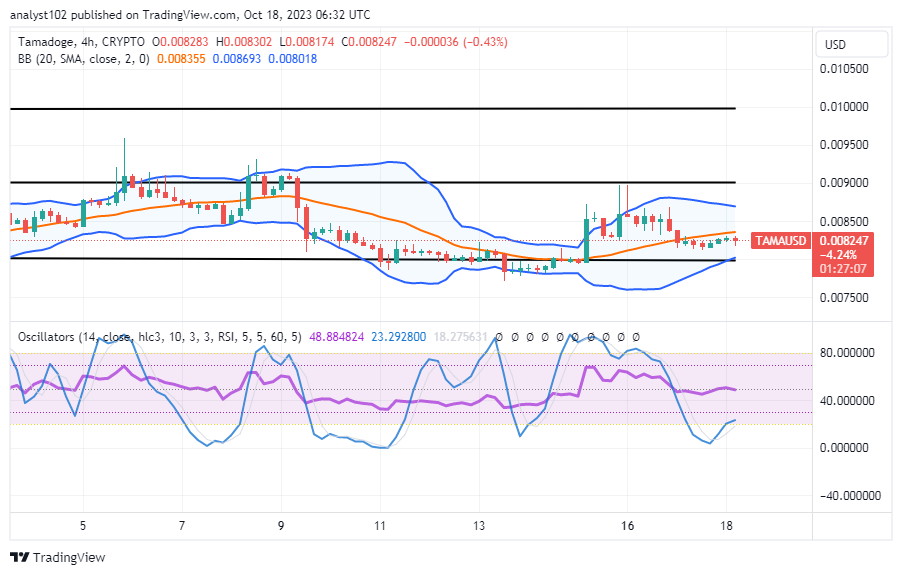
The lower Bollinger Band trend line is positioned around the trade line of $0.008000, indicating the possibility of seeing more lower lows if the market does not surge aggressively in the near future. As of the time of writing this technical piece, this line remains the crucial area to which the price must extend its retracement process. Despite the fact that the price is currently at a negative 0.43%, sellers should be cautious while riding along any format that can result in further advances to the south of the present trading axis of $0.008247.
TAMA/USD Market
Key Levels
Resistance levels: $0.009000, $0.009500, $0.01000
Support levels: $0.007500, $0.007000, $0.006500
TAMA/USD Medium-term Chart
The TAMA/USD medium-term chart reveals that the crypto-economic trade retraces after touching the resistance line of $0.009000, rising above the support level of $0.007500.
The positioning pattern of the Bollinger Bands signifies that the path has been maintained in a slight north direction, as the indicators are staged at 0.008693, $0.008355, and $0.008018. The stochastic oscillators have dipped into the oversold region to range from 48.884824 to 23.292800. It appears that some motions to the downside risk depressing further from around the path of the middle Bollinger Band.
Will the bearish TAMA/USD market move any more to the downside against the $0.008 and $0.0075 points?
The TAMA/USD market sellers attempting to shift more southward against the trade lines of $0.008000 and $0.0075 will potentially encounter a whipsaw as the cryptocurrency price retraces, rising above the smaller value line mentioned.
In the long run, the situation will probably allow the component to expand near the crucial support baseline of $0.007500 if the current pullback intensifies toward the lower Bollinger Band trend line. While all of those circumstances exist, an aggressive recovery will be developing to result in the formation of bullish engulfing candlesticks in an effort to regain some of the most recent momentum lost.
TAMA/USD Short-term chart
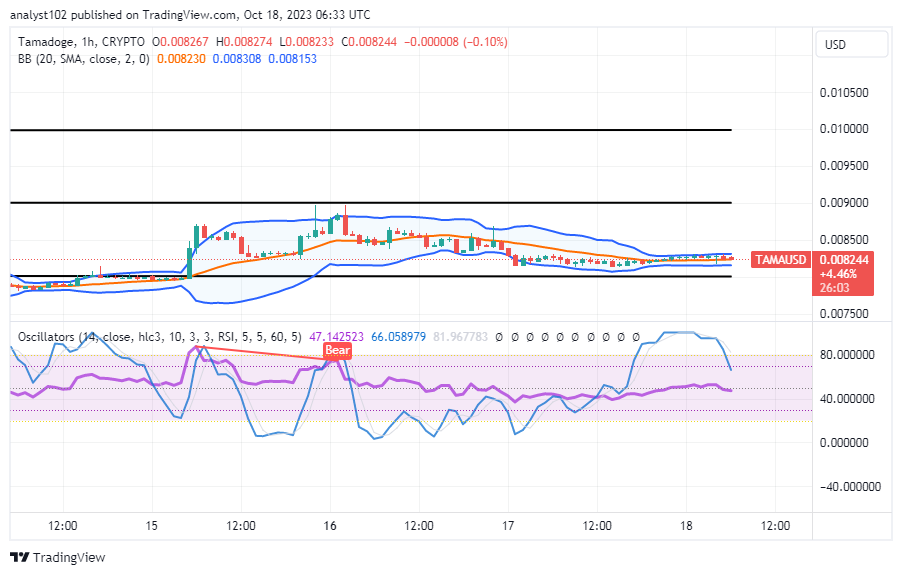
The TAMA/USD short-term chart showcases that the crypto-economic trade retraces to form a series of ranges between $0.008500 and $0.00800, predominantly rising above the support line of $0.007500.
The Bollinger Band trend lines staging from $0.008308, $0.008230, and $0.008153 have provided an affirmation signal to the range-bound areas mentioned above. From 66.058979 to 47.142523, the stochastic oscillators are in a southbound-crossing state. As things stand, further downward force lacks the predisposition ability to withstand the chance of buyers making a comeback, and the price is now more inclined to decline from its bargaining point.
Take advantage of boosted stats to ascend the Tamadoge leaderboards.
Attention #TamadogeArmy! 📣#Tamadoge Rare NFTs Are Up For Sale Now! 💫
— TAMADOGE (@Tamadogecoin) October 17, 2022
Format: Dutch Auction
Starting price: 5 ETH
Reserve price: 0.5 ETH
Length: 48 hours ‼️
Bid Now On @opensea And Enjoy Boosted Stats To Help You Climb The Tamadoge Leaderboards 💪⬇️https://t.co/yHt4SiY6ed pic.twitter.com/SHmqWaAn5U
Do you want a coin that would 100X in the next few months? That is Tamadoge. Buy TAMA today
Note:Forexschoolonline.com is not a financial advisor. Do your research before investing your funds in any financial asset or presented product or event. We are not responsible for your investing results.


Leave a Reply