Tamadoge Price Prediction – August 30
Sequencing to an upsurge from the support line of $0.006000, the Tamadoge trade bulls made the transaction situation rise significantly against the valuation of the US coin to average the resistance of $0.01100 from the underneath before the crypto market begins to move in ranges, keeping spiking indexes.
As it stands, from roughly August 21 until the present, the sideways mode of trading has been primarily served between the value lines of $0.009500 and $0.007500. A violation of either of these two sets of points will, in light of the technical trade thinking that has been maintained, swiftly lead to a specific next direction in the following: Nevertheless, we continue to support ongoing buying rather than selling operations.
TAMA/USD Market
Key Levels
Resistance levels: $0.009500, $0.01000, $0.01050
Support levels: $0.007500, $0.006500, $0.005500
TAMA/USD Medium-term Chart
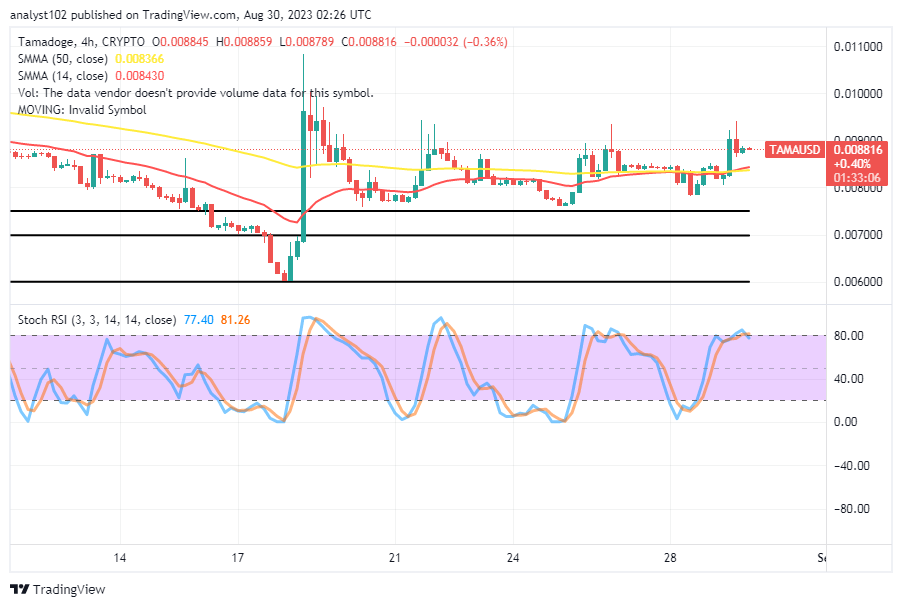
The TAMA/USD medium-term chart reveals that the crypto market ranges, keeping spiking indexes around the trend lines of the moving averages.
A conjoining arrangement occurs between the indicators, yet it signifies that buying and selling may prolong around them for some time before resorting to a parting move. We are presently seeing the 14-day SMA trend line and the 50-day SMA trend line around the values of $0.008430 and $0.008366. The stochastic oscillators are gesturing around 81.26 to 77.40, denoting that a negative session is attempting to resume soon.
Who has a better chance of profiting from TAMA/USD market operations in the aftermath, traders or investors?
Investors have a higher probability of reaping most times than traders, whose speculation methodology is based on quick entry and exit approaches, given that the TAMA/USD market currently ranges between $0.009500 and $0.007500, keeping spiking indexes.
In the interim, it’s possible that the market will shift positions downward to start over, but investors and long-position traders shouldn’t ever abandon their positions in anticipation of any panicky sales. They should go fearlessly with the planned dipping process rather than getting into that.
TAMA/USD Short-term chart
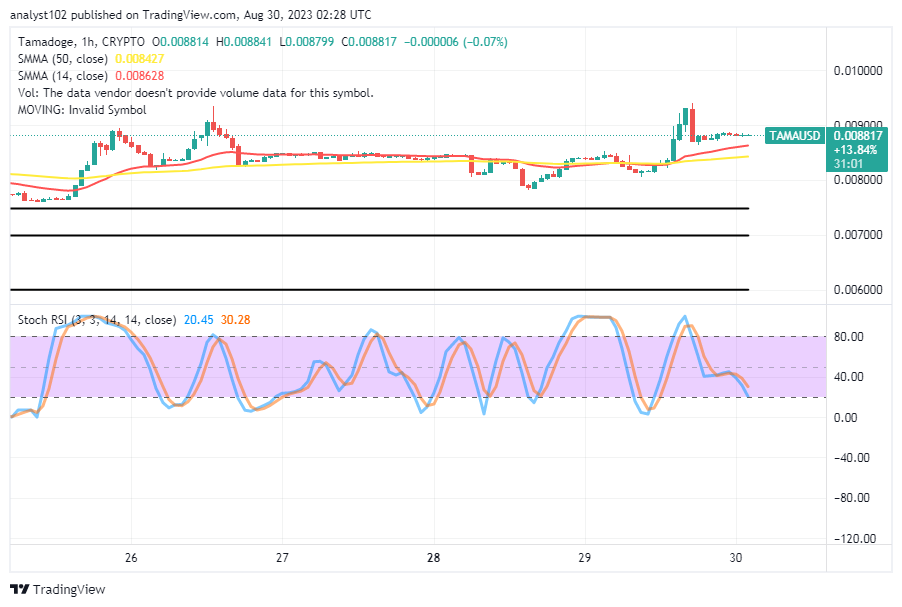
The TAMA/USD short-term chart showcases the crypto trade in ranges, keeping spiking indexes around the positioning outlook of the SMAs.
The 50-day SMA indicator and the 14-day SMA indicator have momentarily crossed upwards. The stochastic oscillators have moved from position 30.28 to 20.45 in a southerly direction. It might not be best to execute positions immediately at this time. Before placing an order, traders who are eager to transact in selling and buying within a short period of time have to consider how responsive the price will be at the upper and lower range points.
Which beast in Tamadoge Arena is the most difficult to defeat?
Which critter in Tamadoge Arena is hardest to beat? 😤
— TAMADOGE (@Tamadogecoin) August 29, 2023
Do you want a coin that would 100X in the next few months? That is Tamadoge. Buy TAMA today
Note:Forexschoolonline.com is not a financial advisor. Do your research before investing your funds in any financial asset or presented product or event. We are not responsible for your investing results.


Leave a Reply