Tamadoge Price Prediction – October 31
A consistent upward rise in pressure has surfaced alongside a straight line in business operations as the TAMA/USD trade pushes up, setting higher lows toward the resistance of $0.009000.
The purchasing frenzy has dominated the market’s slow-moving motion pattern, indicating that sellers are less likely to be able to push the market below the $0.00800 level. The window of opportunity to invest more in the cryptocurrency economy is still open because the price hasn’t yet made a strong recovery.
TAMA/USD Market
Key Levels
Resistance levels: $0.009000, $0.009500, $0.001000
Support levels: $0.008000, $0.007500, $0.007000
TAMA/USD Medium-term Chart
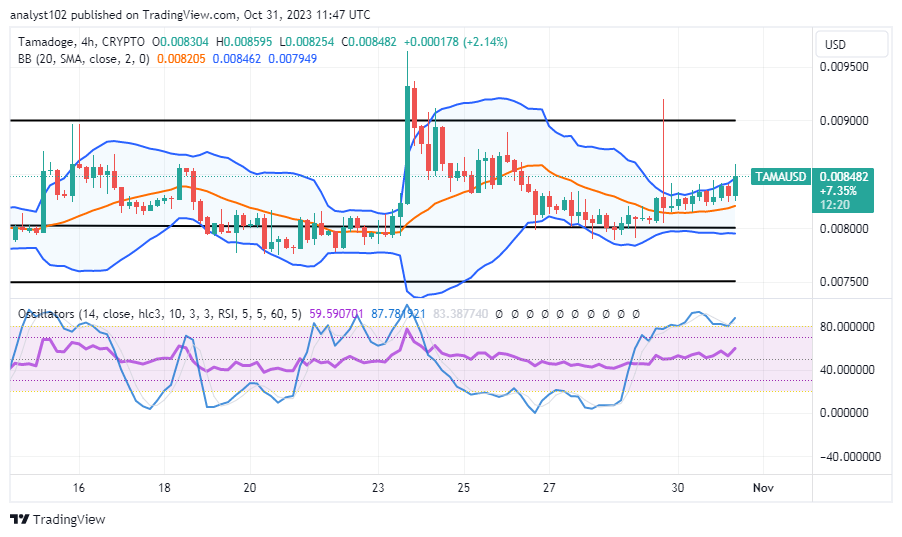
The TAMA/USD medium-term chart reveals that the crypto-economic price pushes up, setting higher lows along the path of the upper trend line of the Bollinger Band.
A general overall technical trade outlook suggests that bulls are in the process of managing to surge higher through some overhead resistance points in the subsequent operations. The stochastic oscillators have been traversing in and around the overbought region in a consolidation style. The Bollinger Bans trend lines are slightly being stretched northward, with the lower part standing around the crucial underlying support of $0.0080000.
Given that the TAMA/USD market is now trading at $0.008482, would it be easy for sellers to obtain respectable shorting entries at this point?
Currently, it appears that an uprising force is on the cards in the market operation involving Tamadoge versus the US Dollar, given that the crypto trade pushes up, setting higher lows.
Bulls’ ability has been comparatively hidden along the upper Bollinger Band trend line, even though there is ongoing uprising pressure. Stated differently, it would be preferable for investors who have not yet entered the market to do so at this time, even if the price tends to move away from its current trading range later on. Trading caution should be used more when selling than when buying, as there is growing expectation that the cryptocurrency market will eventually rebound to very high values.
TAMA/USD Short-term chart
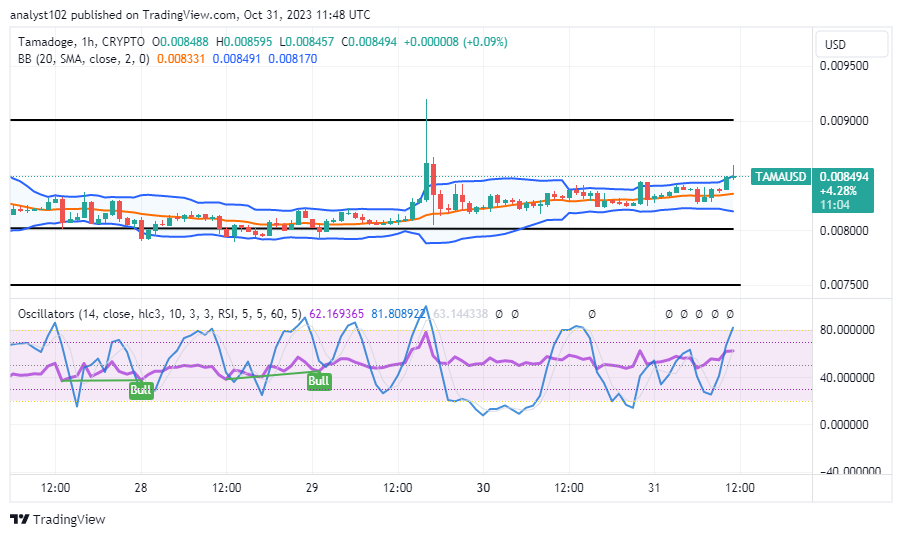
The TAMA/USD short-term chart showcases the crypto-economic market pushing up, setting higher lows along the pathways of the upper and middle Bollinger Band trend lines.
In the direction of the north, the stochastic oscillators point from 63.169365 to 81.808922. The Bollinger Bands’ trend lines are momentarily extending northward while remaining relatively parallel to the east, indicating that bears could make an impact soon. In the end, long-term investment ideas will greatly benefit from this kind of developing cryptocurrency activity.
By leaving a comment on the post below, you can vote for Tamadoge!
📣 Go On #TamadogeArmy!
— TAMADOGE (@Tamadogecoin) October 27, 2022
Vote For #Tamadoge By Leaving A Comment On The Post Below! 🔥
Every Vote Counts!! 🥇⬇️ https://t.co/mTNprCxqSN
Do you want a coin that would 100X in the next few months? That is Tamadoge. Buy TAMA today
Note:Forexschoolonline.com is not a financial advisor. Do your research before investing your funds in any financial asset or presented product or event. We are not responsible for your investing results.


Leave a Reply