Tamadoge Price Prediction, December 6
A closure technical thought has revealed that buyers have been systemically against giving in to tangible reversal motions that have been featured in the TAMA/USD market as the crypto trade pushes north, hovering around the point of $0.0095.
Approximately a few hours ago, a swift reversal movement occured, considering that the price is currently trading at the $0.009248 line as per this technical analysis. The fact that the long-awaited northward gravitational stresses are almost here is becoming increasingly obvious. However, there will usually be a brief series of corrections while the market must halt at a specific higher-trading point at a specific moment. In the long term, investors should keep adding points over the $0.0095 line.
TAMA/USD Market
Key Levels
Resistance levels: $0.01000, $0.01050, $0.011
Support levels:$0.0085, $0.00800, $0.007500
TAMA/USD Medium-term Chart
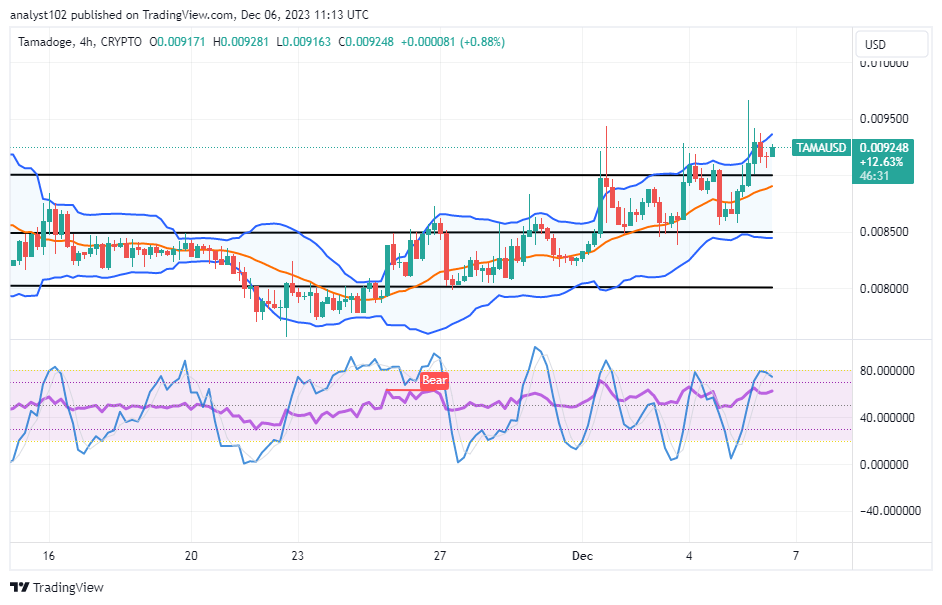
The TAMA/USD medium-term chart showcases the crypto-economic market pushing north, hovering around the point of $0.0095.
It appears that the current formation of candlesticks is around the upper trend line of the Bollinger Band, showcasing and confirming that there is a consolidation motion in place. The Bollinger Bands have been stretched to the upside to near the point of $0.0095. The stochastic oscillators are positioned around a value of 80 to show that buyers are relatively in control of the positive signals that the market has to keep in its journey back to the mooning cycles.
When the TAMA/USD market hovers at $0.0095, should buyers abandon their longer-term positions?
Execution of long position orders is not welcome at this point in the market operations of TAMA/USD, given that the crypto market pushes north, hovering around the point of $0.0095.
As excessive psychological demonstrations have shown, bears are progressively losing positions, even near the Bollinger Bands’ upper trend line. This suggests that traders who have long positions are putting in more effort to consolidate their positions in order to guarantee that they will soon enter fully bullish trading cycles. The number of positions added to increase the size of investors’ portfolios should be consistent.
TAMA/USD short-term chart
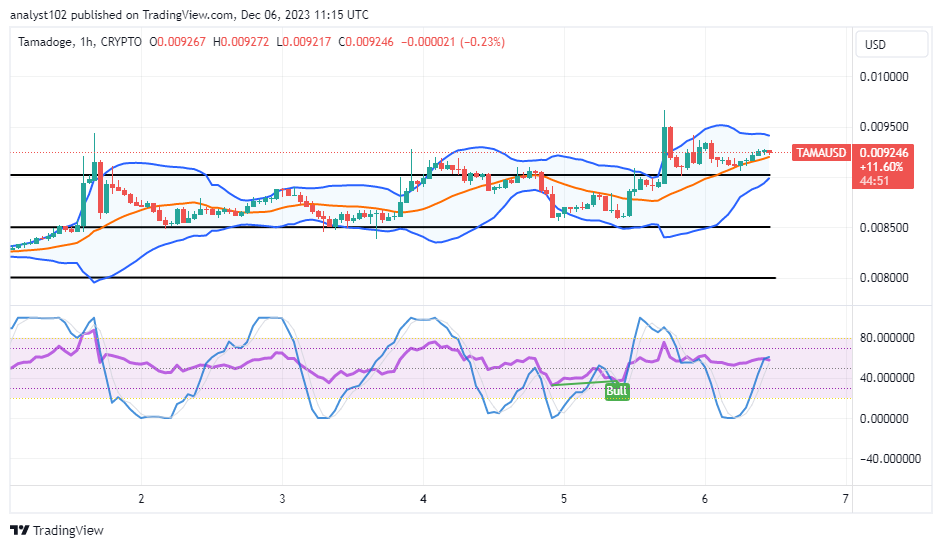
The TAMA/USD short-term chart reveals the crypto market pushes north, hovering around the value line of $0.0095.
Since both the upper and bottom sides of the middle Bollinger Band trend line are ominously pointing north, enclosing the values of $0.0095 and $0.00900, it has been crucial in identifying the upward trajectory. In order to indicate that purchasers may benefit the most if the lower point at $0.0085 is not reversed terrified over time, the stochastic oscillators are momentarily pointing upward.
Fill your bags with $TAMA and fight in the arena.
Fight in the Arena and fill your bags with $TAMA 💰
— TAMADOGE (@Tamadogecoin) December 6, 2023
Download Tamadoge Arena on mobile 👇
📱 Android: https://t.co/INCaGenLtC
📱 iOS: https://t.co/Fj9tT5OQ22 pic.twitter.com/TK5mxaO6sz
Do you want a coin that would 100X in the next few months? That is Tamadoge. Buy TAMA today
Note:Forexschoolonline.com is not a financial advisor. Do your research before investing your funds in any financial asset or presented product or event. We are not responsible for your investing results.


Leave a Reply