Tamadoge Price Prediction – August 14
Yesterday’s business activity attempted to skyrocket in the Tamadoge market against the US currency, given that the crypto trade pulled down, resettling a rebound.
Between $0.009000 and $0.008500, another round of crucial barrier trading has been observed, making the higher value the more significant resistance line against the present upward force. For the time being, the lower point frequently serves as the critical active zone where purchasers can refuel.
TAMA/USD Market
Key Levels
Resistance levels: $0.009000, $0.009500, $0.010000
Support levels: $0.008000, $0.007500, $0.007000
TAMA/USD Medium-term Chart
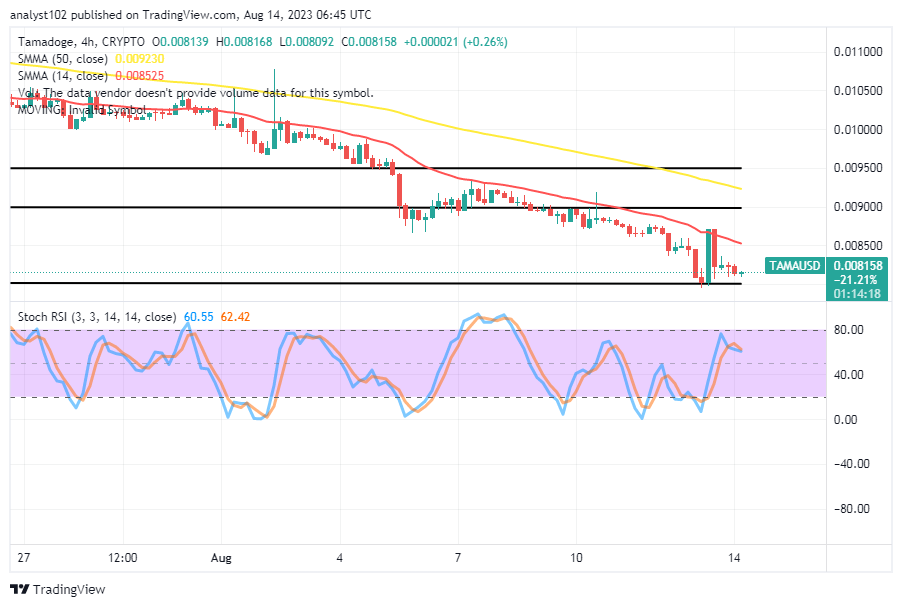
The TAMA/USD medium-term chart reveals that the crypto-economic trade pulls down, resettling into rebound characteristics.
The 50-day SMA indicator is at $0.009230, placing it above the $0.008525 value line of the 14-day SMA indicator. The operation’s surviving soldiers are now at a standstill. The Stochastic Oscillators have moved from north to south from 62.42 to 60.55 points, indicating that a downturn is likely to continue.
Does the Oscillators’ current position foretell the possibility of a collapse in the TAMA/USD market below the $0.009000 resistance line?
There is still a greater chance of seeing more probable decompression trade sessions featuring below the resistance line of the TAMA/USD market at $0.0090000, as we are now having it that the crypto market pulls down, resettling a rebound imputed toward its base of around $0.008000.
When a certain asset is trading at a low price, long-term investors would have a better opportunity to continue buying the dips at various psychological levels of discount and let the positions run for a long time before considering capping their gains. Buyers are advised to keep an eye out for the formation of a bullish engulfing candlestick on the daily chart to take advantage of the wall that the subsequent operations will part with to the upside and create a more distinct beginning of the projected growing cycle.
TAMA/USD Short-term chart
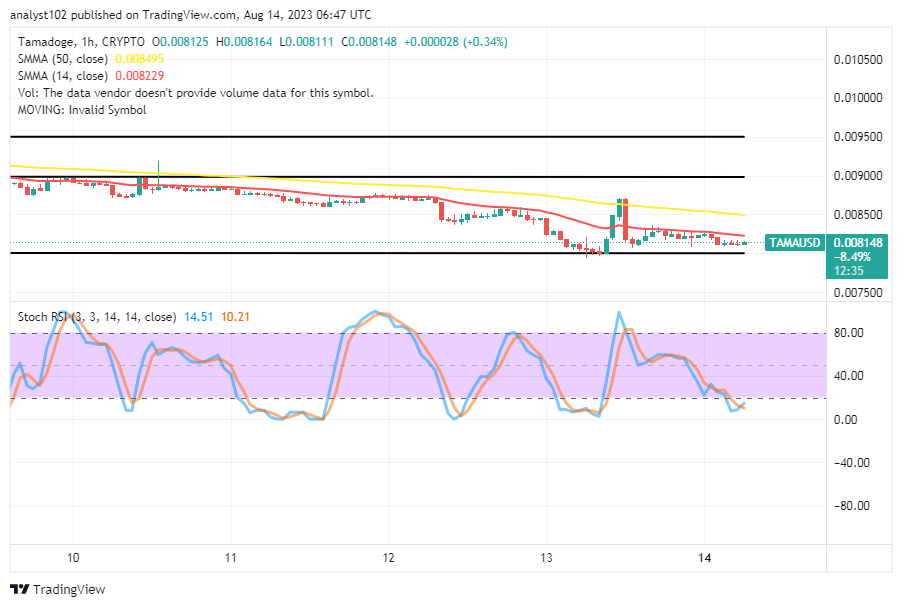
The TAMA/USD short-term chart shows the crypto-economic trade pulling down, resettling a rebound signal toward the base of $0.008000.
As the trend line of the 50-day SMA continues to be above them, retaining a value of $0.008495, the 14-day SMA trend line has recently been positioned tightly over a variety of smaller candlesticks that have been generated. The stochastic oscillators have slipped into the oversold area and are showing signs of trying to move from 10.21 to 14.51 values back northward. Regarding pushes in a northerly direction, hope shouldn’t completely vanish.
Your Monday will taste better if you add a little Tamadoge Arena to it.
Sprinkle a lil’ Tamadoge Arena on your Monday to sweeten it up 😉 👇https://t.co/INCaGendE4
— TAMADOGE (@Tamadogecoin) August 14, 2023
Do you want a coin that would 100X in the next few months? That is Tamadoge. Buy TAMA today
Note: Forexschoolonline.com is not a financial advisor. Do your research before investing your funds in any financial asset or presented product or event. We are not responsible for your investing results.


Leave a Reply