Tamadoge Price Prediction, December 29
More desirable pushing capacity efforts have been on the rise, indicating that bulls are making positive waves in the market appearance of Tamadoge versus the worth of the US coin, as the situational financial record now portends that it muscles up, a growing sign.
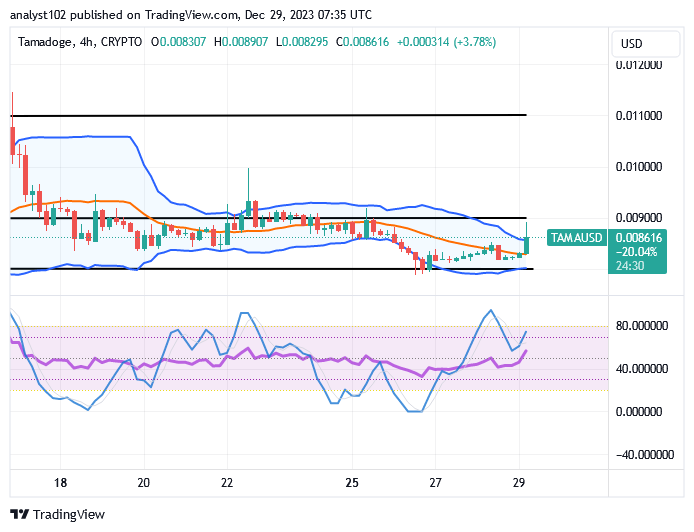
From the middle of the Bollinger Band, a 4-hour bullish candlestick has formed, striving to break through the top side at a modest speed. And as a result, the market’s line has reversed, reversing about $0.008616. The general trade consensus at this point is still that purchases must be made without fear.
TAMA/USD Market
Key Levels
Resistance levels: $0.00950, $0.01050, $0.01150
Support levels:$0.00800, $0.00700, $0.00600
TAMA/USD Medium-term Chart
The TAMA/USD medium-term chart reveals that the crypto-economic trade muscles up, nurturing a growing sign.
The Bollinger Band trend lines are positioned relatively down to show that buying aptitudes are being made. A lower spot around the lower trend line of the Bollinger Band has the tendency to serve as the main support line toward regaining strength to push back upward. The stochastic oscillators are keeping a sound bouncing signal to keep the hope of buyers alive.
What trade-probability stance does the TAMA/USD market bear at this point, as the price trades around $0.008616?
As there has been a slight retracement in the market valuation of the TAMA/USD, buyers’ degrees of responsiveness tend to override the majority of selling moods that could feature in the near future. Given that the crypto-economic trade muscles up, nurturing a growing sign across the indicators of the Bollinger Bands.
The lower Bollinger Band trend line has positioned itself to indicate that some of the highlighted areas will be significant places suitable for making speculative entrances, as the current situation makes clear. The revised observation confirms that a line of pullbacks may be felt temporarily to allow purchasers to reassess their positions in light of a dropped value.
TAMA/USD short-term chart
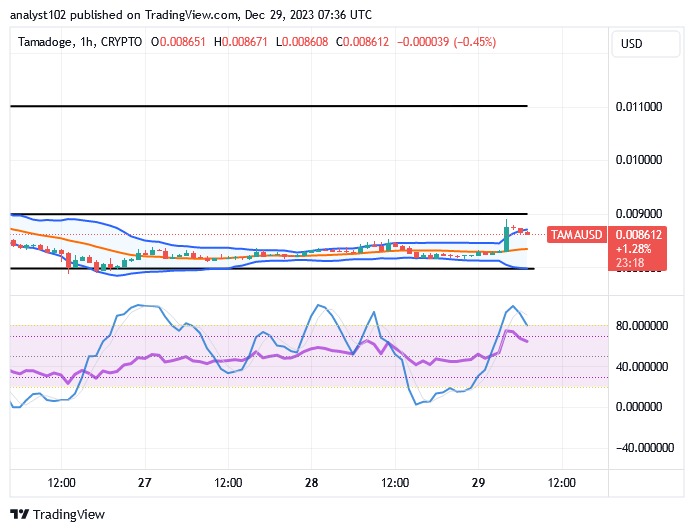
The TAMA/USD short-term chart reveals that the crypto’s trade muscles are up, a growing sign.
The $0.00900 and $0.00800 marks have continued to be the focal points of the Bollinger Band trend lines. And that suggests that buying and selling are limited to a variety of trading strategies. The overbought area has been entered by the stochastic oscillators and long-position placers.
Play any of the Tamadoge games to earn $TAMA, then stake your winnings to see your money grow even more.
Play, Earn, Stake, Repeat.
— TAMADOGE (@Tamadogecoin) December 28, 2023
Earn $TAMA playing any of the Tamadoge and stake your winnings to increase it further.
Check out our staking platform here 👉 https://t.co/7BgBa7MRfD pic.twitter.com/labFbL1FB7
Do you want a coin that would 100X in the next few months? That is Tamadoge. Buy TAMA today
Note:Forexschoolonline.com is not a financial advisor. Do your research before investing your funds in any financial asset or presented product or event. We are not responsible for your investing results.


Leave a Reply