Tamadoge Price Prediction, February 29
A lot of efforts have surfaced on a promissory potency note that the TAMA/USD market may soar at any time with a low profile that has been witnessed over a couple of sessions.
The price action pattern that has been rearranged so far towards the negative appears to be forming bases around $0.005, with the underlying support around $0.004 serving as the crucial lower zone. Thus far, most presumptions that have been made are in order to create a favorable trading environment where additional money may be committed to positions at clearly defined lower zones ahead of either a rallying or rebounding push.
TAMA/USD Market
Key Levels
Resistance levels: $0.0060, $0.0070, $0.0080
Support levels: $0.0050, $0.0040, $0.0030
TAMA/USD Medium-term Chart
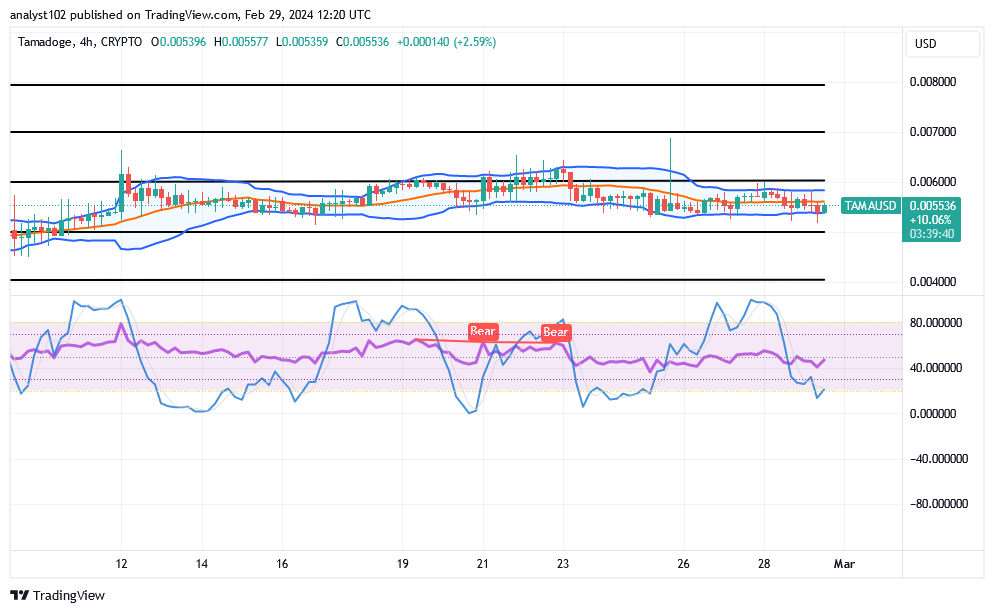
The TAMA/USD medium-term chart showcases that the crypto-economic market may soar with its current low-profile financial records.
The arrangement settings of the indicators have most times been lading to a good promissory crypto signal that better days are in the pipeline as regards the worth of the Tamadoge versus the market stances of the US coin. The Bollinger Band indicators have continually been placed within the points of $0.006 and $0.005. The stochastic oscillators have penetrated the oversold region to denote that gravity on the market on the negative route has been reduced considerably.
How has the TAMA/USD market reacted thus far to the reduced Bollinger Band?
It appears that the TAMA/USD market has been technically finding a decent re-opening order for making long position orders around the lower Bollinger Band, given that the price is tending to soar with low-profile bookings.
As things stand, the majority of the circumstances continue to support investors’ need to stick with the strategy of protecting and holding onto their cryptocurrency economy against US fiat money. The Bollinger Band indicators must indicate in real time when to take a stand against any declining pace at a given moment. There is going to be a strong breach of the $0.006 resistance level in the time that more volitile moves feature.
TAMA/USD short-term chart
The TAMA/USD short-term chart showcases the economy of Tamadoge, which may soar soon against the US Dollar with a low-profile financial record.
The Bollinger Band signs at $0.006 and $0.006 have been consistently extending eastward, indicating that a trend of sideways moves is still significant in the market. The stochastic oscillators have turned downward into the oversold region to attempt a northbound-crossing mode posture around 20. . That suggests that, at the time of this analysis, purchasing activity is comparatively outweighing other attitudes.
Experience the thrill of our free-to-play Tamagotchi-style software, where you can earn TAMA by taking care of your own adorable pet!
Dive into the fun of our free-to-play Tamagotchi-style app where you can earn $TAMA by caring for your own adorable pet!
— TAMADOGE (@Tamadogecoin) February 29, 2024
Download Tamadogi on Android & iOS now to start earning 👇
📱 Android: https://t.co/RfZIZOLaNJ
📱 iOS: https://t.co/du3iReizS4 pic.twitter.com/gFxppuh3sI
Do you want a coin that would 100X in the next few months? That is Tamadoge. Buy TAMA today
Note: Forexschoolonline.com is not a financial advisor. Do your research before investing your funds in any financial asset or presented product or event. We are not responsible for your investing results.


Leave a Reply