Tamadoge Price Prediction – September 18
A consistent depression level has continually surfaced to signify that buyers are softening their stances in the TAMA/USD market activities as the crypto-economic trade makes a base around the $0.00900, aiming for spikes.
A line of price reactions that have appeared recently, centered around the price of $0.09000, indicates that selling practices are about to lose out. At this moment in the market, a purchasing frenzy will drive higher values through the previously specified target. Expectations are still pointing in the direction of breaking the $0.01000 resistance figure.
TAMA/USD Market
Key Levels
Resistance levels: $0.01000, $0.01100, $0.01200
Support levels: $0.008500, $0.07500, $0.06500
TAMA/USD Medium-term Chart
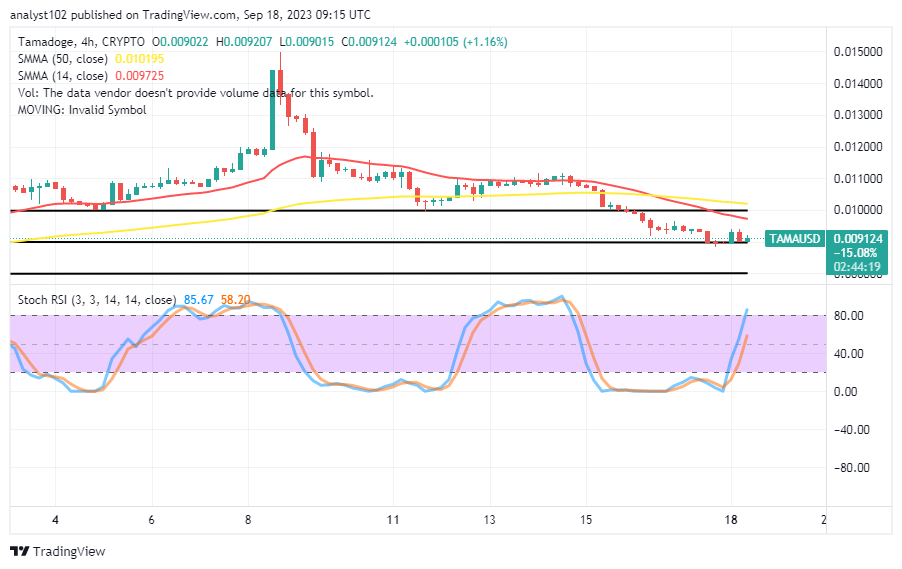
The TAMA/USD medium-term chart reveals that the crypto-economic trade makes a base bordering around the line of $0.009000, aiming for spikes along the line.
The 50-day SMA’s value line is at $0.010195, while the 14-day SMA indicator is at $0.009725. The price formation process has been progressing in a bearish direction, suggesting that it is time to start purchasing at a discount. The northern stochastic oscillators have moved between 58.20 and 85.67. Sellers are not anticipated to stay longer than is absolutely required, even with that presumption in place.
What is currently the expectation placed upon purchasers in the TAMA/USD market?
There has been a financial record situation coming forth in which the price is running below the market values of the moving averages, given that the TAMA/USD trade makes a base, aiming for spikes.
Slowly but steadily, the tendency to move to the south side is beginning to emerge. Long-position placers are to maintain their positions above support levels of between $0.009000 and perhaps in the extension of $0.008500 while repositioning their positions to the upside. It was important to remember that buyers should have faith in their ability to eventually turn any investment they make into a profit.
TAMA/USD Short-term chart
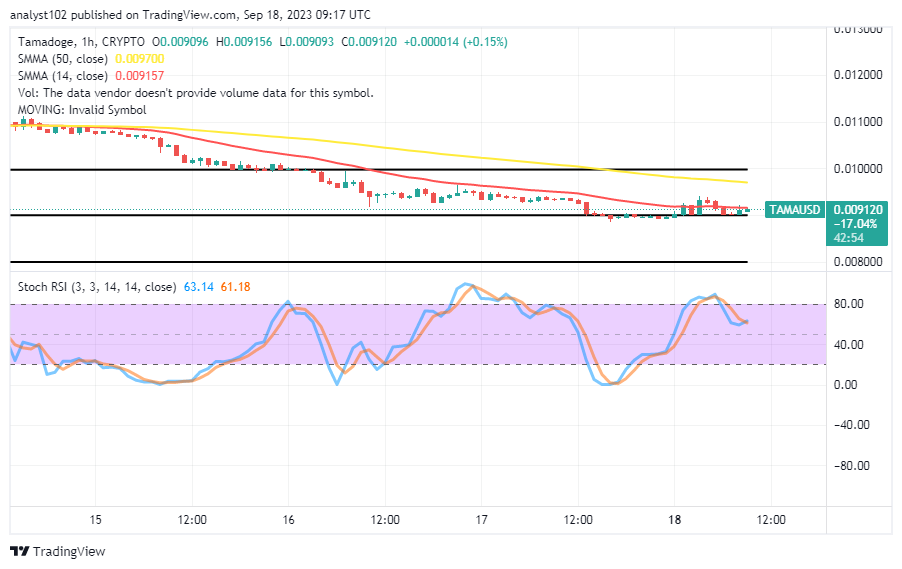
The TAMA/USD short-term chart depicts the crypto-economic trade making a base around the line of $0.009000, aiming for spikes from around the trend line of the smaller moving averages.
The 50-day SMA trend line is below the 14-day SMA trend line. The trading indicators are set between $0.01000 and $0.009000 at the current period of operation. The stochastic oscillators have marginally crossed south before quickly crossing back north, remaining between values of 61.18 and 63.14.
Tamadoge Arena’s prize pool keeps expanding.
The prize pool for Tamadoge Arena keeps on rising 🌕
— TAMADOGE (@Tamadogecoin) September 15, 2023
Play Arena on mobile and earn your share of $TAMA now 👇
📱 Android: https://t.co/INCaGendE4
📱 iOS: https://t.co/Fj9tT5Oicu pic.twitter.com/buNMFBL0VY
Do you want a coin that would 100X in the next few months? That is Tamadoge. Buy TAMA today
Note:Forexschoolonline.com is not a financial advisor. Do your research before investing your funds in any financial asset or presented product or event. We are not responsible for your investing results.


Leave a Reply