Tamadoge Price Prediction – August 2
It is currently observed that the Tamadoge trade is deepening a fall around $0.01000 and is about to bounce up.
A proof of concept has been established to confirm that the cryptocurrency market is now expanding its base of support to encompass the $0.01000 mark. Buyers will need to push back upward from within the points of $0.009753 and $0.009808 with a lower percentage rate number at the time of this technical analysis. However, we have been fostering the anticipation that we will eventually witness such a decrease in trading since that is a typical opportunity to stick with the buy the dips strategy.
TAMA/USD Market
Key Levels
Resistance levels: $0.01100, $0.01150, $0.01200
Support levels: $0.00950, $0.00900, $0.00850
TAMA/USD Medium-term Chart
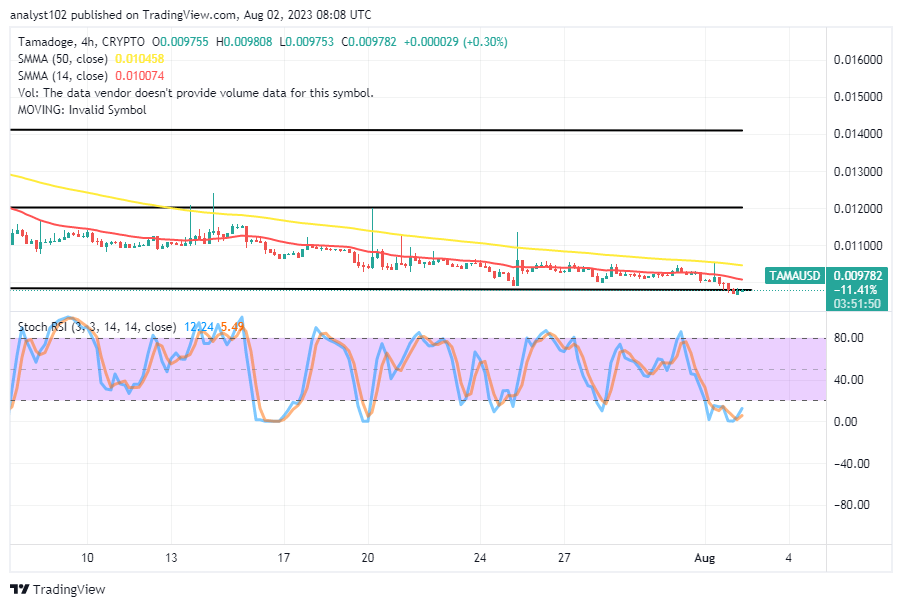
The TAMA/USD medium-term chart reveals that the crypto-economic trade deepens a fall at $0.01000 and is about to bounce from the pivotal point.
The lower horizontal line drawn at $0.01000 will remain to serve as an instrument toward deciding a decent buy order, given that the 14-day SMA trend line and the 50-day SMA trend line have placed over the market’s trading points. The Stochastic Oscillators have moved into the oversold region, managing to swerve northbound from 5.49 to 12.24. Time is on the verge of ripening toward stable increases.
What likely structure would investors in the TAMA/USD market follow to re-enter the higher entry points’ recovery stages?
In the TAMA/USD trade, investors will be potentially composing energies to rise through various resistance points where buy entry orders might have been executed by way of sequentially increasing outlooks in the long run, as we are now having the crypto-economic trade deepen a fall around $0.01000 as it is about to bounce up.
Although there is a fair amount of low activity around $0.010 overall, this is still one of the rare opportunities to initiate a buy from the dumps. A recurring sequence of events that culminates in placing a purchase order from a support position typically continues over time or even declines to extend the accumulation of momentum prior to an unanticipated massive value explosion.
TAMA/USD Short-term chart
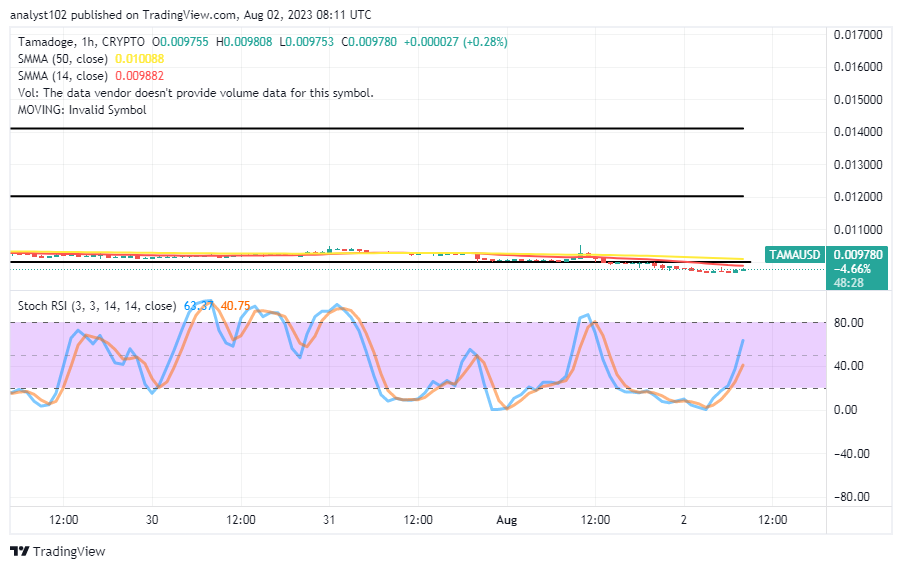
The TAMA/USD short-term chart showcases the crypto market’s deepening fall around $0.01000, about to bounce up through some barrier lines in no time.
Buyers are advised to act quickly before the surge increases past the 14-day SMA indicator’s $0.009882 and the 50-day SMA, which are both located at $0.01088. The Stochastic Oscillators are in a state of northward crossover, indicating that bulls are attempting to push back up from a level that is just below the psychological support line of $0.0100.
Warning: The Tamadoge Arcade may include lethal penguins; parental monitoring is advised.
WARNING: Parental supervision advised – deadly penguins lurking in the Tamadoge Arcade… pic.twitter.com/0Zw39tAuiB
— TAMADOGE (@Tamadogecoin) August 1, 2023
Do you want a coin that would 100X in the next few months? That is Tamadoge. Buy TAMA today
Note: Forexschoolonline.com is not a financial advisor. Do your research before investing your funds in any financial asset or presented product or event. We are not responsible for your investing results.


Leave a Reply