Tamadoge Price Prediction, January 7
Following the inability of bulls to resume farful uprising velocities against the motion of bears, given that the TAMA/USD trade presently lowers action, keeping a bounce index even below the values of the middle and upper Bollinger Bands,.
The garnering process of catalysts has been prolonged by allowing untradeable decline motions. Sellers will probably be trapped in a situation where they will lose position if they plan to play along with the moves. A technical trading perspective advises against investors intending to give up on accumulating points.
TAMA/USD Market
Key Levels
Resistance levels: $0.0085, $0.0090, $0.0095
Support levels:$0.00700, $0.0065, $0.0060
TAMA/USD Medium-term Chart
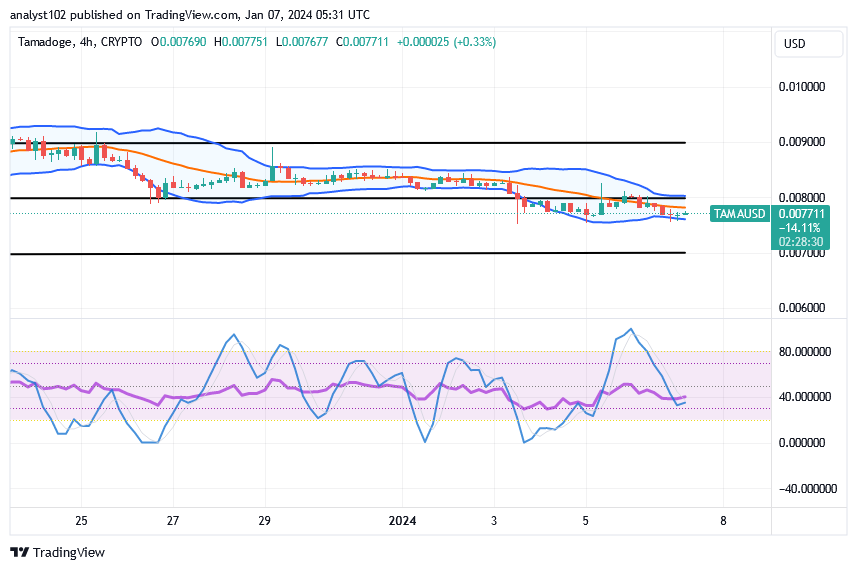
The TAMA/USD medium-term chart reveals that the crypto-economic trade lowers action, keeping a bounce input closely around the trending axis of the lower Bollinger Band.
The stochastic oscillators have crossed southbound to get resettling for a pattern to signify that price actions are potentially going to resume soon. The Bollinger Band trend lines have been prolonging their positional points in such a manner as to produce lower points for buying opportunities at a lower speed capacity of the market.
Should buyers in the TAMA/USD market hold off on initiating positions in the Bollinger Bands, as per the article’s point?
It is highly recommended that the TAMA/USD market purchasers not put off securing more positions, as the situation currently has it that the crypto business operation lowers action and keeps a bounce input even in those proceedings.
The trade candlestick formation has been exhibiting a tendency to form a line that may lead to support buildings above the $0.00700 mark. It has been showcased that a rare reduction moment has been created around the trending axis of the lower Bollinger Band for long-position placers to take advantage of. Currently, drivers in short positions should use extreme caution when attempting to drive southward. Prospective investors should not let this opportunity pass them by by delaying their financial commitments until after the start of meaningful recovery inputs.
TAMA/USD short-term chart
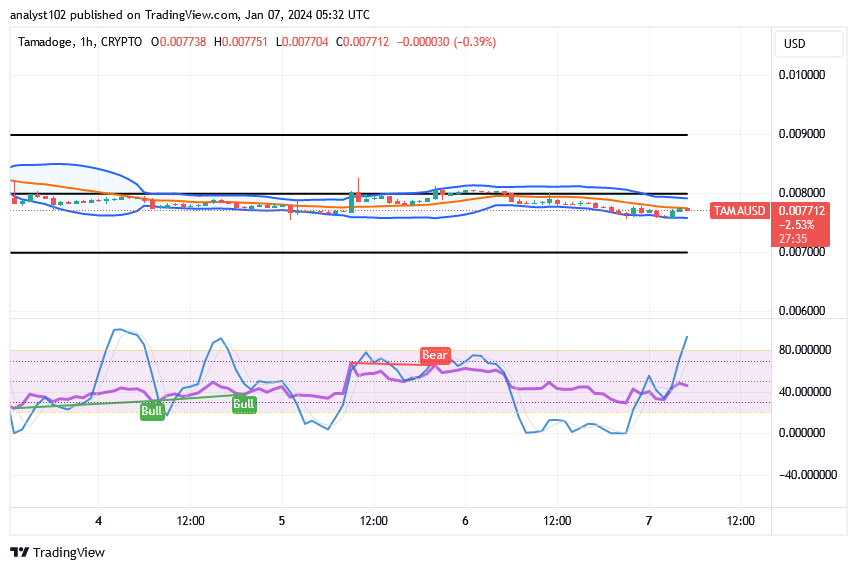
The TAMA/USD short-term chart shows that the crypto-economic trade lowers action and keeps a bounce index in the Bollinger Bands.
The ability of the stochastic oscillators to veer northward suggests that the cryptocurrency economy will have an upswing, primarily in opposition to selling activity. The Bollinger Bands are systemically moving eastward, which is causing the values within the hourly-based indicators’ modest spacing capacity to diminish. Buyers should not be afraid to apply for many positions.
To get your weekly TAMA, play any of our games. You can then stake it to make it even greater.
Gaming = Earning
— TAMADOGE (@Tamadogecoin) January 6, 2024
Play any of our games to earn your weekly $TAMA and then stake it to increase it further. pic.twitter.com/RvVihN7jzx
Do you want a coin that would 100X in the next few months? That is Tamadoge. Buy TAMA today
Note:Forexschoolonline.com is not a financial advisor. Do your research before investing your funds in any financial asset or presented product or event. We are not responsible for your investing results.


Leave a Reply