Tamadoge Price Prediction, November 26
In recent operations, buyers and sellers have been transacting in a down-trending manner in trades that involve Tamadoge versus the US Dollar, as the crypto loses impulse around the point of $0.008500, reasserting rallies motion toward the lower end line of $0.007500.
As of the writing of this analytics article, it seems that more windows of opportunity for purchasing will be maintained in the rebuilding state in addition to allowing prospective capitalists to enter at significantly lower prices before bouncing paths. Investors should be confident and optimistic that better, aggressive bouncing days are still ahead of them, even though the indicators may appear to be showing lower in the Bollinger Bands’ binderies in the coming months.
TAMA/USD Market
Key Levels
Resistance levels: $0.0085, $0.009000, $0.009500
Support levels: $0.007500, $0.007000, $0.006500
TAMA/USD Medium-term Chart
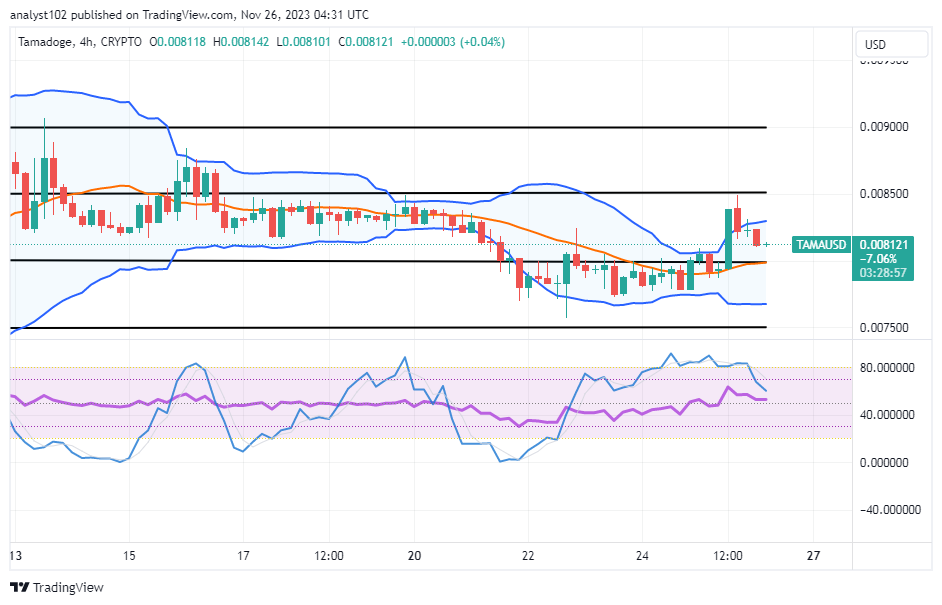
The TAMA/USD medium-term chart reveals the crypto market loses impulse, reasserting rallies and moving bids below the logical point of $0.008500.
The stochastic oscillators are currently showcasing that bearish candlesticks have been forming on a four-hourly basis as the market trades around the point of $0.008121. The Bollinger Band trend lines are positioned between the boundary lines of $0.008500 and $0.007500.
What is the best strategy that traders should adhere to regarding the TAMA/USD market’s present price trend?
Accumulation process has to be exercised by long-term investors, and buyers should continue to add more positions as the TAMA/USD trade loses impulse, reasserting rallies.
There have been arguments made for the purposeful resurfacing of price actions in order to cause corrections that have the potential to unexpectedly trigger recoveries. Within the boundaries of the middle and lower Bollinger Band trend lines, certain scenarios might still emerge. Regardless of any potential subsequent retracements, we advocate taking more secure positions.
TAMA/USD short-term chart
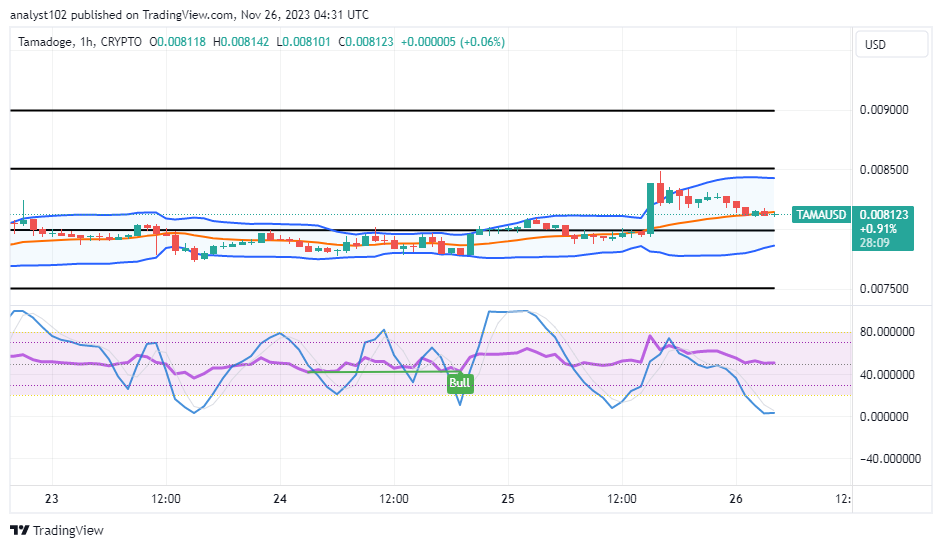
The TAMA/USD short-term chart showcases the crypto trade losing impulse following the process of averaging the point of $0.008500, reasserting rallies.
The $0.008500 and $0.007500 trend lines contain the Bollinger Band trend lines, which are oriented comparatively northward. The stochastic oscillators are stylishly stepping down in the oversold region, denoting that the base-trading instrument is working toward securing positions against the US coin. It is advisable for bears to exercise caution when supporting any downward push towards the $0.007500 underlying support point.
You can earn a share of the weekly prizes by playing five different games, each with its own leaderboard!
Earn $TAMA across the five play-to-earn games in Tamadoge Arcade 👾
— TAMADOGE (@Tamadogecoin) November 25, 2023
Each game has it’s own leaderboard, giving you five games to earn a share of the weekly prizes!
Available on Android & iOS 👉
📱 Android: https://t.co/3PXpfUAM0J
📱 iOS: https://t.co/UN5MlRGh44 pic.twitter.com/BeUs24c68w
Do you want a coin that would 100X in the next few months? That is Tamadoge. Buy TAMA today
Note:Forexschoolonline.com is not a financial advisor. Do your research before investing your funds in any financial asset or presented product or event. We are not responsible for your investing results.


Leave a Reply