Tamadoge Price Prediction – November 7
The transaction line between buyers and sellers in the market operations of Tamadoge against the purchasing power of the US Dollar currently lingers around the value of $0.00800, tending to bounce.
The price action featured between both bull and bear has been steadily around the Bollinger Band indicators, indicating the prolongation of ranging motions. And it is capable of causing indecision sessions some times. Before the significant mounting pressures that the new cryptocurrency has been predicted to experience in the coming months resume, those indications’ points should be preserved from a differential trade perspective.
TAMA/USD Market
Key Levels
Resistance levels: $0.008500, $0.009000, $0.009500
Support levels: $0.007500, $0.007000, $0.006500
TAMA/USD Medium-term Chart
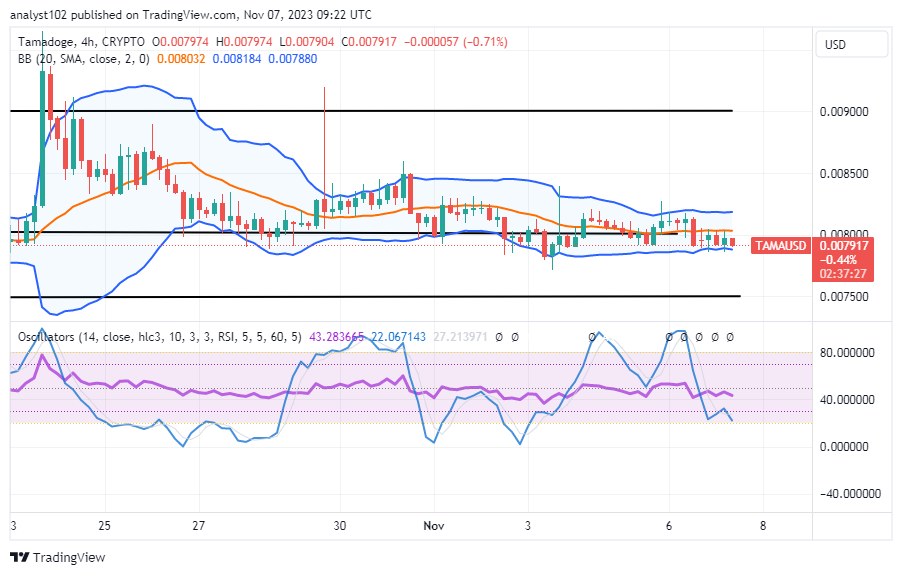
The TAMA/USD medium-term chart depicts the crypto market lingering its valuation around the line of $0.00800, tending to bounce even as the price shifts slightly downward.
The stochastic oscillators are in a southbound-crossing mode, positioning from 43.283665 to 22.067143. The Bollinger Band trend lines are positioned at $0.008184, the middle part is at $0.008032, and the lower line is situated at $0.007880 in that order.
Is the TAMA/USD market still undervalued despite its current sideways movement in price?
Several attempts have represented a series of ups and downs around the trend lines of the Bollinger Band, which still suggest that the TAMA/USD market is underpriced, given the crypto trade lingers around the point of $0.00800, tending to rebound.
Based on the range-bound trends that the market has been following for the past several sessions, this shouldn’t come as a surprise. One thing that traders should keep in mind about the zones where the ranges have been occurring is that they present a chance for building positions. When the decimation of price valuations becomes a regular point, a better day is coming. To do that, it would be wiser to focus your attention on the long-term structure of the cryptocurrency economy. 
TAMA/USD Short-term chart
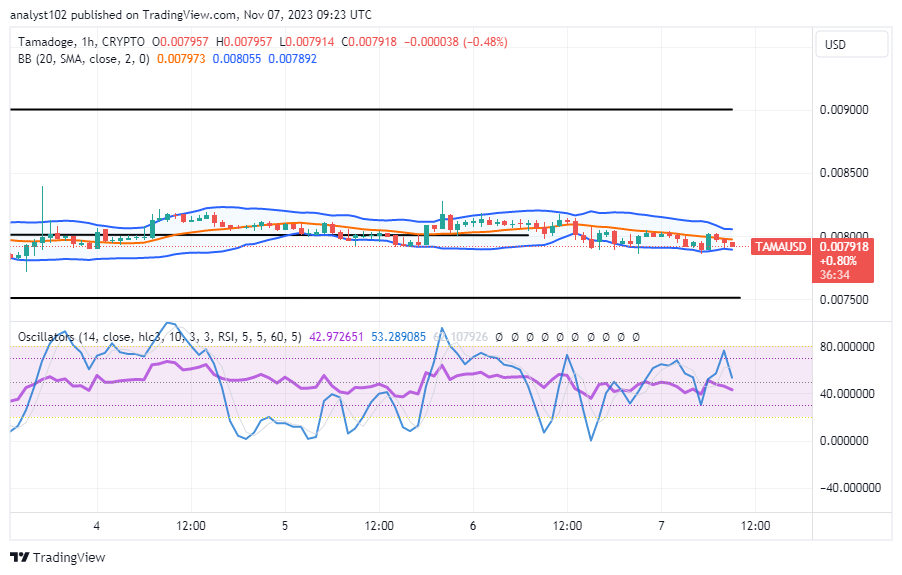
The TAMA/USD short-term chart showcases the cryptocurrency trade lingering around the line of $0.00800, tending to bounce.
The trend lines of the Bollinger Band are at $0.008055, $0.007973 for the middle line, and $0.007892 for the lower section. Additionally, they are hesitantly curving southward to suggest that the buyer is starting to get traction. From 53.289085 to 42.972651, the stochastic oscillators are speculatively positioned southward. There is a cautionary message advising sellers not to follow any forces that move lower than $0.00800.
Give your Tamadoge some strength training at the pet supply store. In every game, increase your Tamadoge’s strength to gain more lives and absorb less harm.
Stat Attack: Strength 🏋️
— TAMADOGE (@Tamadogecoin) November 6, 2023
Give your Tamadoge some muscle power in the Pet Store. Level up your Tamadoge’s strength to get more lives and take less damage across all games.
Try on Tamadoge Arcade today 👇
📱 Android: https://t.co/3PXpfUBjQh
📱 iOS: https://t.co/UN5MlRGOTC pic.twitter.com/ZSlDSrtQsz
Do you want a coin that would 100X in the next few months? That is Tamadoge. Buy TAMA today
Note:Forexschoolonline.com is not a financial advisor. Do your research before investing your funds in any financial asset or presented product or event. We are not responsible for your investing results.


Leave a Reply