Tamadoge Price Prediction – September 21
Reactions of pricing operations around the logical trade arena of $0.009000 in the TAMA/USD market have been taking a positive response to a financial situation, showcasing that the crypto trade is shifting position to the lower side, searching for bounce-offs that could occur unprecedentedly.
No matter how significant a negative impact the American dollar has on the Tamadoge market below the aforementioned point, buyers and investors are advised not to entertain any abrupt panic sells. It demonstrates that the moves to the south side are still able to recover their positions from a poor negotiating position. It is technically acceptable for longing behaviors to begin experimenting with cryptocurrency economic values at any one time, given its reduced moving outlook.
TAMA/USD Market
Key Levels
Resistance levels: $0.01000, $0.01100, $0.01200
Support levels: $0.008500, $0.07500, $0.06500
TAMA/USD Medium-term Chart
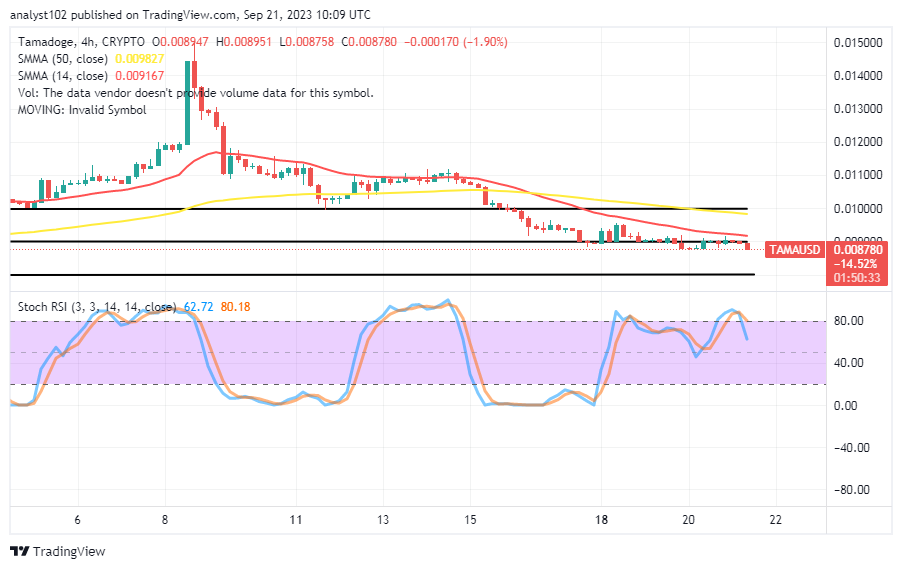
The TAMA/USD medium-term chart reveals that the crypto trade is shifting slightly downward, searching for bounce-offs.
The long-holding style of the indicators above the candlesticks over time suggests that the cryptocurrency’s valuation is yet to trade out of the danger of depression as the 14-day SMA is underneath the 50-day SMA. The stochastic oscillators are in a slight southbound-crossing mode from the overbought region to places from 80.18 to 62.72.
Can a reversal of the current fall against $0.009000 lead to further rises afterward?
A reversal of the fall at the time of declining against the line of $0.009000 has to be fearful to produce more rises afterward as the TAMA/USD trade is shifting and searching for bounce-offs.
In an effort to locate a posture where a swing high will be produced, descending motions through a few lows beneath the place in issue have been consistently common. Freshly intended stakeholders or investors should enter the market now, while it is still favorable, before a surge in value occurs.
TAMA/USD Short-term chart
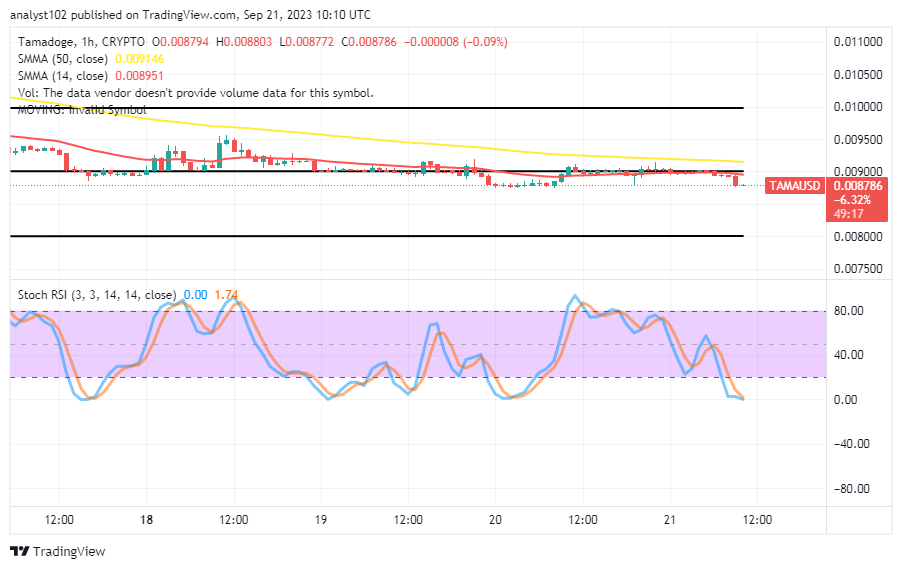
The TAMA/USD short-term chart reveals the crypto-economic trade is shifting lines to average a lower support toward $0.008500, searching for bounce-offs.
The 50-day SMA trend line’s value line is $0.009146, while the 14-day SMA trend line is located at $0.008951 underneath it. The stochastic oscillators are still maintaining values between 1.74 and 0.00 while moving into the oversold area. Because the oversold condition has been visible on a daily chart arrangement for a while, it would be perilous for sellers to continue opening short bets despite the declining force.
We’re excited to share Part Two of our Mystery Project Roadmap with you, Tama Army.
Stay tuned to our social media to be the first to know. We’ll be releasing Mystery Project 4 next week.
Tama Army! We’re pleased to announce Part Two of our Mystery Project Roadmap 🎉
— TAMADOGE (@Tamadogecoin) September 21, 2023
Stay tuned to our socials to be first to hear. We’ll launch Mystery Project 4 next week 🐶 pic.twitter.com/3vu7pRLF5R
Do you want a coin that would 100X in the next few months? That is Tamadoge. Buy TAMA today
Note:Forexschoolonline.com is not a financial advisor. Do your research before investing your funds in any financial asset or presented product or event. We are not responsible for your investing results.


Leave a Reply