Tamadoge Price Prediction, March 11
Systemically, the bulls’ impact in the TAMA/USD market operations has been gradually conjectured with a less reliable force to firmly hold against the pushing pressure of the US Dollar, given that the trade is erratic in their movements, keeping hike signs.
The frequent occurrence of volatile price velocities to the upside can occasionally induce fear and lead one to avoid trading. Putting that presumption aside, most forces of resistance have a tendency to align steadily during a complete daily bullish candlestick that can eclipse some hypothetical penultimate falling candlesticks.
TAMA/USD Market
Key Levels
Resistance levels: $0.019, $0.020, $0.021
Support levels: $0.010, $0.009, $0.008
TAMA/USD Medium-term Chart
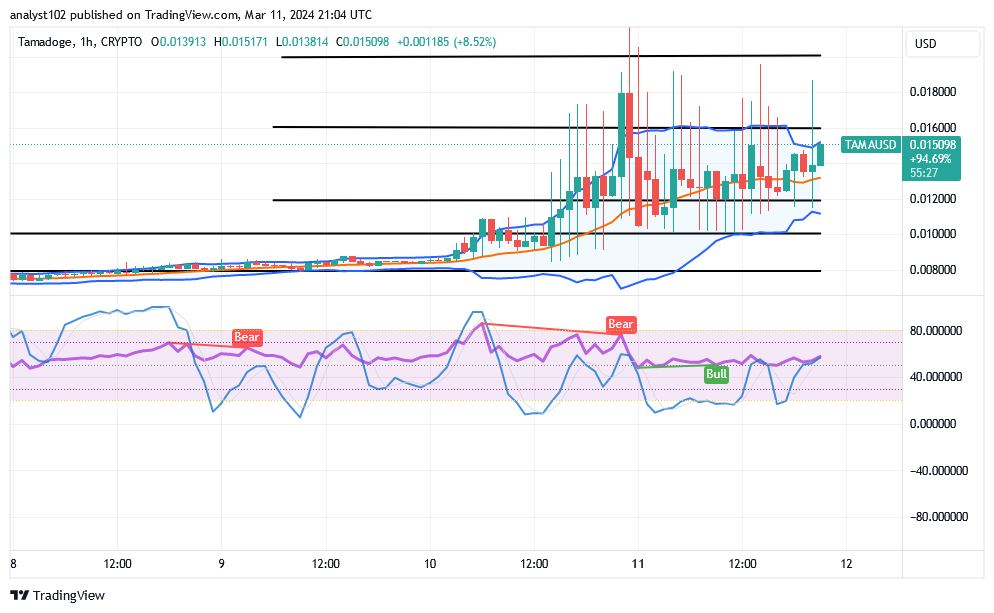
The TAMA/USD medium-term chart showcases that the crypto-economic trade is erratic in its motions, as they are keeping hike signs.
The Bollinger Band trend lines have managed to get repositioned a bit highly around $0.010 and $0.016. A series of different candlesticks has formed to push northwardly beyond the upper part of the indicator, coupling them with quick reverses. The stochastic oscillators have positioned themselves at considerable lower trading zones to establish that different recouping capacity efforts are being made to push to the north.
When a reversion mode is identified, should investors in the TAMA/USD market promptly cash out the majority of their points?
It would not be an ideal form of investing for capitalists to always quickly pull out of the market while mere reversion modes are tending to be made, as the TAMA/USD market is erratic, keeping hike signs.
Basically, two horizontal lines have been drawn to mark out points between $0.012 and $0.010 as the major key points for the market to not let there be more stable fall-offs in the long-term running manner. Put differently, purchasers must continue to recoup against the majority of tenable, rapid adjustments that the price may be inclined to make.
TAMA/USD short-term chart
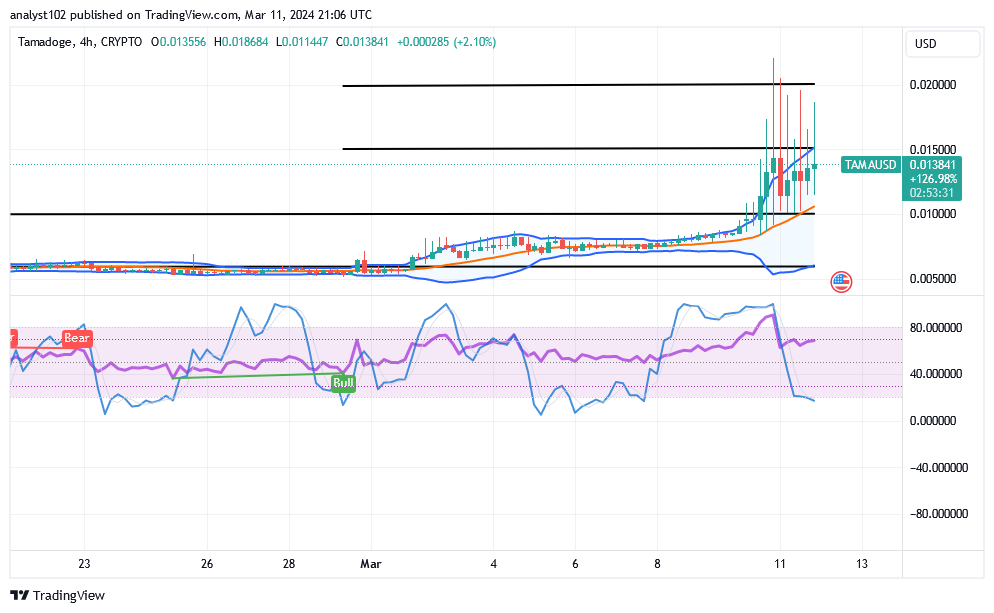
The TAMA/USD short-term chart showcases how the crypto market is erratic in its movements, keeping hike signs.
As the market’s gravity rises, the upper portion of the Bollinger Band trend lines has been observed to extend northward. The stochastic oscillators have entered the oversold area with a near traverse to the south. That indicates that there’s a chance that pressures in the next moves will be more positive than negative.
Enter the world of Tamadoge games and see how much money you can make with TAMA!
Dive into the world of Tamadoge games and watch your $TAMA earnings grow!
— TAMADOGE (@Tamadogecoin) January 16, 2024
Play, earn, stake, and repeat for an endless cycle of excitement and rewards 🎉
Check out all of our games on mobile now 👇
📱 Android: https://t.co/D4TjX7gTFl
📱 iOS: https://t.co/0fjJapf5oA pic.twitter.com/7QrRJ2V98s
Do you want a coin that would 100X in the next few months? That is Tamadoge. Buy TAMA today
Note: Forexschoolonline.com is not a financial advisor. Do your research before investing your funds in any financial asset or presented product or event. We are not responsible for your investing results.


Leave a Reply