Tamadoge Price Prediction – October 26
The present financial record shows that bears are holding relatively firm against the pushing ability of bulls in the market operations of Tamadoge versus the valuation of the US Dollar, as the crypto trade is correcting, tending to hike around a lower zone of the $0.00800.
Sellers seem to be grouping their motions together according to the medium term. The price is currently trading at $0.008034 in an effort to continue finding a way below the $0.007500 support line. In anticipation of large recoveries, long-term investors will allocate their capital as the forces progressively move lower.
TAMA/USD Market
Key Levels
Resistance levels: $0.00900, $0.009500, $0.01000
Support levels: $0.007500, $0.007000, $0.006500
TAMA/USD Medium-term Chart
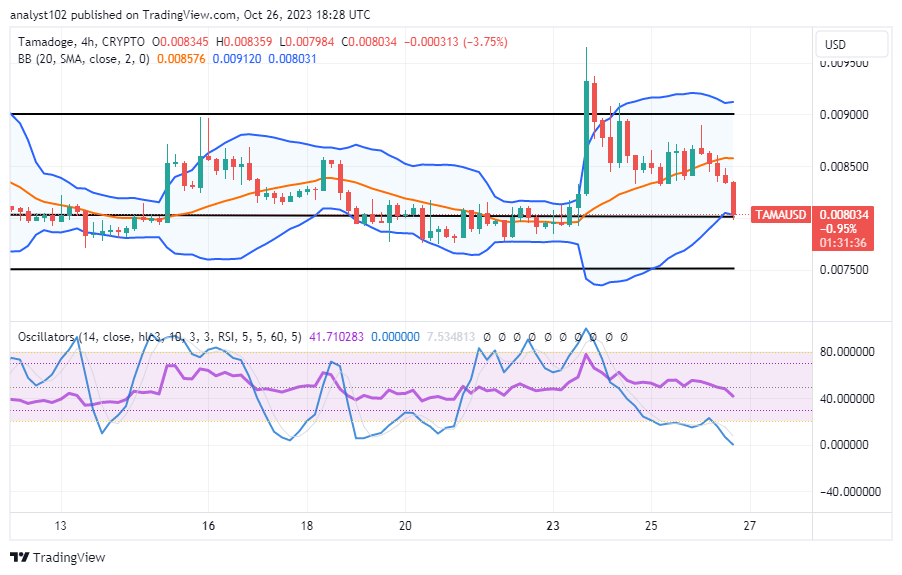
The TAMA/USD medium-term chart reveals that the crypto-economic trade is correcting, tending to hike from the trend line of the lower Bollinger Band.
The Bollinger Band indicators’ values are positioned at $0.009120, $0.008576, and $0.008031. The stochastic oscillators are positioned from 4441.710283 to 0.000000 points, signifying that the motion to the downside is gradually heading downward to a state of completion.
Should buyers panic and buy against the present bearish-trading candlestick in the TAMA/USD trade now that it has struck the lower end of the Bollinger Band?
The current proceeding operations in the TAMA/USD market portend the need to buy from the dipping condition, given that the crypto trade is correcting from the topside of the Bollinger Band and tending to hike from the side of the lower Bollinger Band trend line.
We advise that the purchasing order should continue even though there may be more reductions against the indicator’s lower side due to the extended downward push that has created a bearish path and touched the lower portion of the Bollinger Band trend line. Bulls aren’t anticipated to tolerate any further lows below $0.007500 in the interim, even if it means extending the retracement process for a few days. Investors ought to hedge against further cuts to the present trading zone.
TAMA/USD Short-term chart
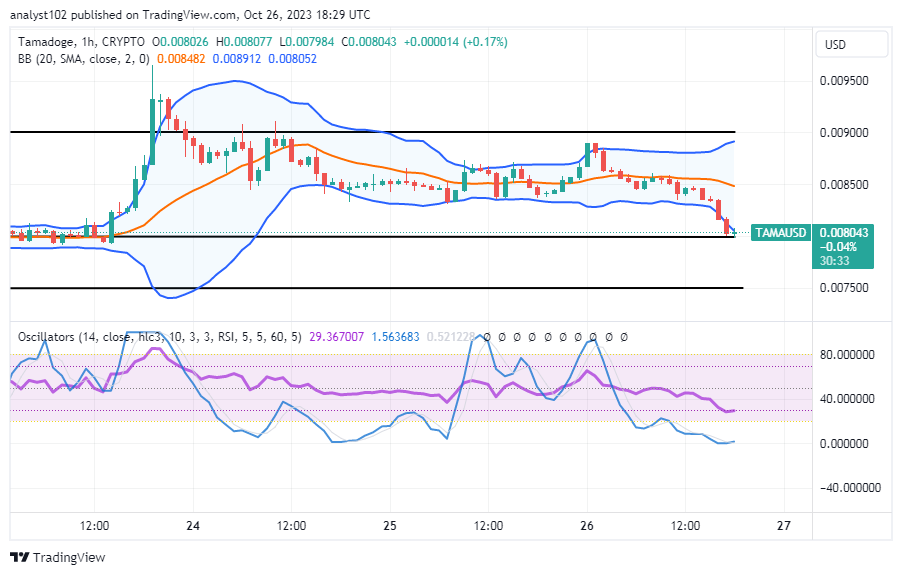
The TAMA/USD short-term chart showcases that the crypto-economic trade is correcting, tending to hike from around the point of $0.00800.
The $0.008912, $0.008492, and $0.008052 marks are where the Bollinger Band trend lines are positioned. The values of the stochastic oscillators range from 29.367007 to 1.563683. A faint bullish return signal has emerged, suggesting that purchasers are thinking about making rebounds in the near future.
Playing any of the Tamadoge games will allow you to keep burning more TAMA, and we’ll burn even more throughout the year.
Mega Burn One is complete 🔥
— TAMADOGE (@Tamadogecoin) October 25, 2023
Proof 👉 https://t.co/edA3OTV7jO
You can keep adding to the burn by playing any of the Tamadoge games and we’ll keep burning more $TAMA throughout the year too 💪 pic.twitter.com/OUOvaPeBRw
Do you want a coin that would 100X in the next few months? That is Tamadoge. Buy TAMA today
Note:Forexschoolonline.com is not a financial advisor. Do your research before investing your funds in any financial asset or presented product or event. We are not responsible for your investing results.


Leave a Reply