Tamadoge Price Prediction, January 3
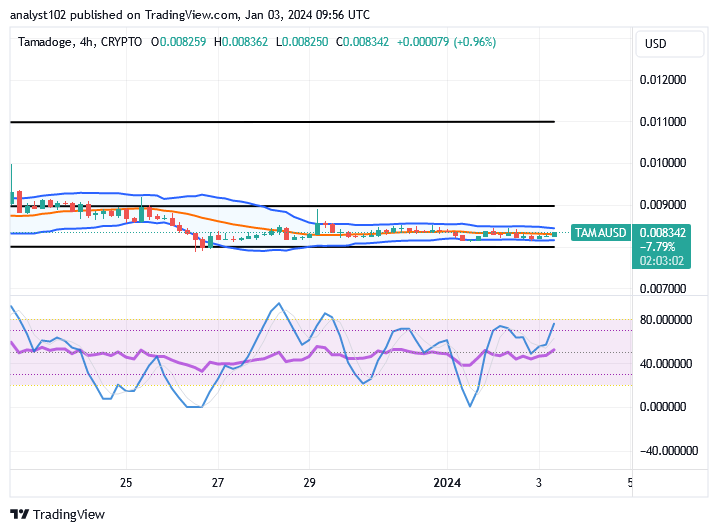
Prolongation of a series of lower ups and downs has been ongoing for a couple of sessions in the Tamadoge market operations versus the US currency, as the situation currently portends that the crypto-economic trade is confined to the trade points of $0.00900 and $0.00800, posing hikes.
The swerving pace pattern of the oscillating indicators has been indicating that the situation may tend to still elongate the format until a while around the point of $0.00800. It is preferable for those who take long positions to continue staking positions ahead of the uprising cycle, which is undoubtedly on the verge of continuously accumulating catalysts, in order for that prediction to be upheld.
TAMA/USD Market
Key Levels
Resistance levels: $0.0090, $0.0100, $0.0110
Support levels:$0.0075, $0.00700, $0.0065
TAMA/USD Medium-term Chart
The TAMA/USD medium-term chart showcases that the crypto-economic market is confined within the values of $0.00900 and $0.00800, posing a hike signal.
The stochastic oscillators have been maintaining a northbound-swerving mode closely above the point of 40. And a smaller, 4-hour candlestick is in the making to signify that the buying spree is striving to prevail. The Bollinger Band indicators have been consistently moving in an east direction between the horizontal lines of $0.009 and $0.008.
As the TAMA/USD market is limited to the $0.009 and $0.008 ranges, what should be the trader’s course of action right now?
As the Bollinger Band indicators embody the trade operations between Tamadoge and the US coin, buyers are expected to be in a better position to keep on adding to their values, posing a hike signal.
In the event that the current trading level of $0.008342 is prone to encountering further lows, the trade situational outlook is designed to enjoy going tightly above the point of $0.00800. This allows one to restore the basis for generating great buying inputs. However, instead of choosing to place short position orders, long position placers are required to stake more positions if they so choose.
TAMA/USD short-term chart
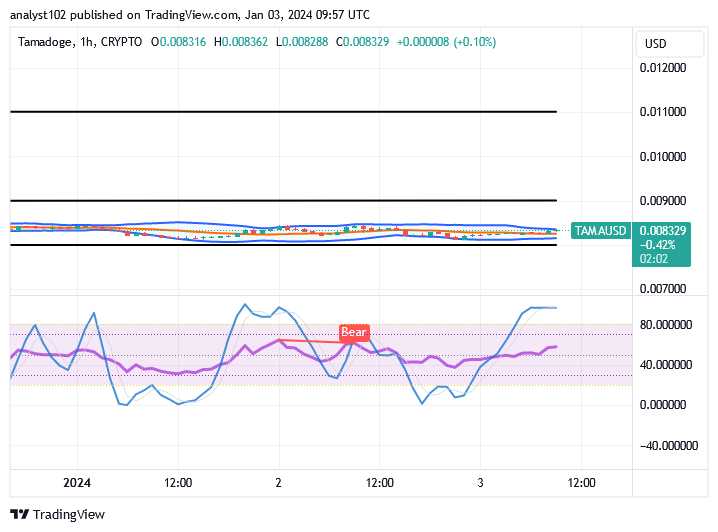
The TAMA/USD short-term chart reveals that the crypto-economic trade is confined to the values of $0.00900 and $0.00800, posing a hike sign.
While the price has been showing signs of drifting sideways, the Bollinger Band indicators have been rising closer above the $0.00800 line. The blue line has entered the overbought area according to the stochastic oscillators, indicating that, as of the time of this technical picture, bulls have reasonably spent their forces on an hourly basis. Conversely, since the line is still underpriced, customers should continue to support the idea of earning more points.
In the Tamaverse, unleash the might of your Tamadoge!
Boost your performance in Tamadogi, our newest free-to-play game, and in other Tamadoge games!
Unleash the power of your Tamadoge in the Tamaverse!
— TAMADOGE (@Tamadogecoin) January 1, 2024
Level up in Tamadogi, our latest free-to-play game, and elevate your performance across all Tamadoge games!
Download now 👇
📱 Android: https://t.co/WMzdqcg5XN
📱 iOS: https://t.co/74nF2hAOwd pic.twitter.com/7GGpJ9TCFd
Do you want a coin that would 100X in the next few months? That is Tamadoge. Buy TAMA today
Note:Forexschoolonline.com is not a financial advisor. Do your research before investing your funds in any financial asset or presented product or event. We are not responsible for your investing results.


Leave a Reply