Tamadoge Price Prediction, February 5
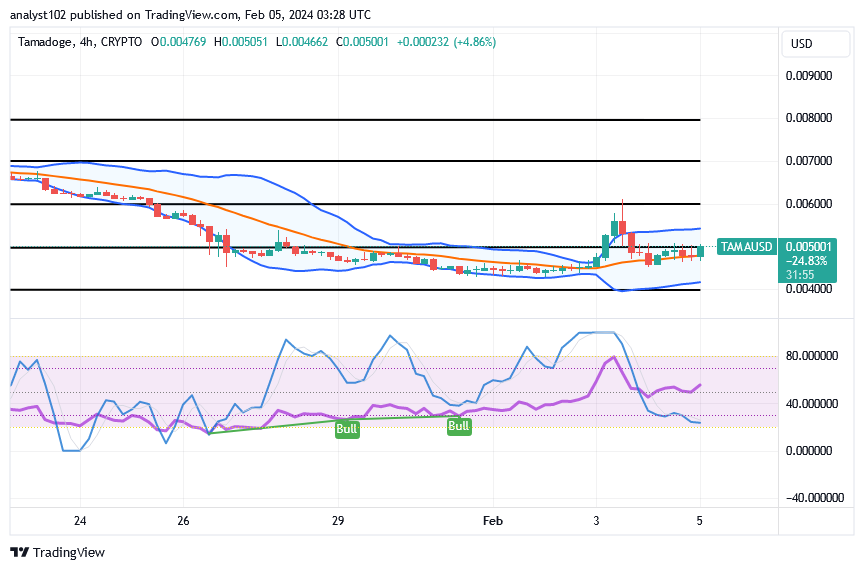
Price velocities of the TAMA/USD market operations have been gradually reducing to the downside to demonstrate that the crypto-economic trade holds a plus index, catalyzing around the point of $0.005.
The price has been gradually approaching the middle Bollinger Band trend line, which is the axis around which a base is being formed. If bulls are going to show that they are making excellent deals later on, there needs to be another strong upsurging pressure that results in long-term movements to the moon over the $0.006 resistance.
TAMA/USD Market
Key Levels
Resistance levels: $0.0060, $0.0070, $0.0080
Support levels: $0.0040, $0.0030, $0.0020
TAMA/USD Medium-term Chart
The TAMA/USD medium-term chart showcases the crypto-economic market holding a plus sign, catalyzing around the point of $0.005.
The stochastic oscillators have the blue part dipping in the oversold region, indicating that forces in the south direction are likely not going to take firmer stances. The Bollinger Band trend lines are positioned around the points between $0.006 and $0.004, indicating vital trade lines to obtain ups or downs.
Should buyers in the TAMA/USD market be wary of purchasing against the $0.006 mark in the event that a bounce-off occurs?
A sudden bounce-off against the value line of $0.006 will potentially put long-position movers on a better hedge toward getting more increases, as the TAMA/USD market currently holds a plus indication, catalyzing around the value of $0.005.
There have been speculations of multiple bounces over the lower Bollinger Band trend line. In both positive and negative terms, it is a situation where investors are able to accumulate more holdings, regardless of the extent of drops that are often available in the vicinity of the $0.004 mark. Sellers should exercise greater caution while pursuing additional downward paths.
The TAMA/USD short-term
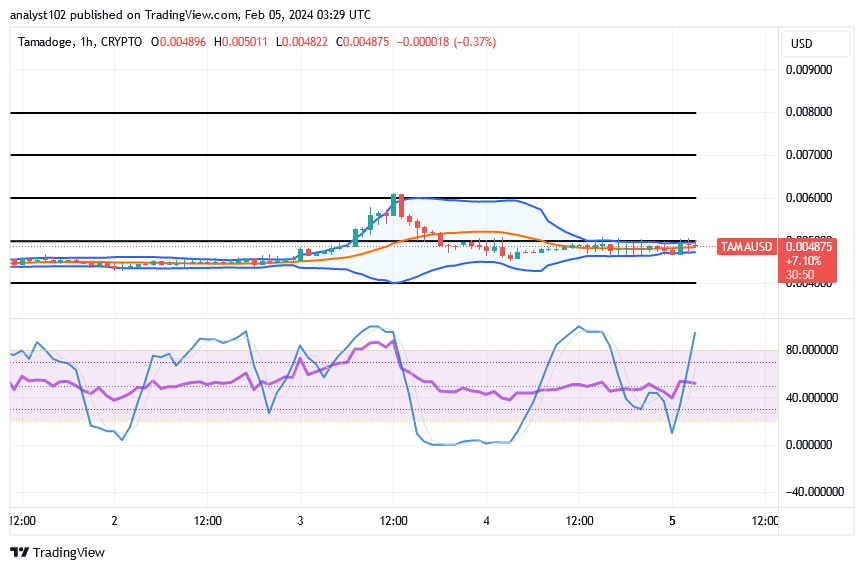
The TAMA/USD short-term showcases the crypto market’s plus index, catalyzing around the line of $0.005.
Around the $0.005 trading line, the Bollinger Band trend lines have converged to form a small easterly shrinkage. There are positive impulses being made, as indicated by the stochastic oscillators’ northward swerve. A line of smaller candlesticks forming alongside the oscillators’ wavy ups and downs indicates that a trading pause may still occur for a certain amount of time.
We are delighted to notify you about Tamadoge’s impending move to Polygon! Check out the details in this thread or in our Discord channel. 1/8
We’re excited to announce that Tamadoge is moving to Polygon! Read the details in this thread or on our discord. 1/8 pic.twitter.com/PjgxJa8TDa
— TAMADOGE (@Tamadogecoin) January 29, 2024
Do you want a coin that would 100X in the next few months? That is Tamadoge. Buy TAMA today
Note: Forexschoolonline.com it a financial advisor. Do your research before investing your funds in any financial asset or presented product or event. We are not responsible for your investing results.


Leave a Reply