Tamadoge Price Prediction – April 25
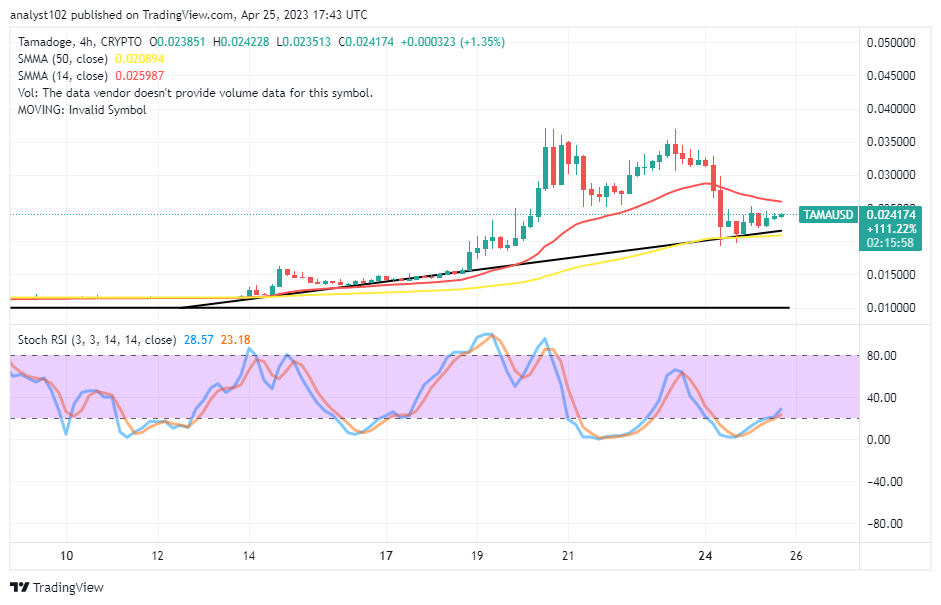
So much fewer trading activities have been compiled in the trading index of the TAMA/USD trade sellers as the crypto-economic market showcases a lower-rising confluence over the line of $0.02000. Recently, some decreasing moves feebly occurred in an attempt to break past the value line. But they lack sustainable capability. Price is currently bargaining around $0.024174 at an average positive percentage rate of 1.35.
10x Crypto Listing by Tamadoge ByBit $TAMA Best Memecoin of 2023?
https://www.youtube.com/watch?v=tXNaJEjeA7w
TAMA/USD Market
Key Levels
Resistance levels: $0.03000, $0.03500, $0.04000
Support levels: $0.01500, $0.01000, $0.00500
TAMA/USD – 4-hour Chart
The TAMA/USD 4-hour chart, as the medium-term based analytics tool, reveals that the crypto-economic business market is engaging in a lower-rising confluence pattern between the trend lines of the SMAs. The 14-day SMA indicator is at $0.025987 point above the $0.020894 value line of the 50-day SMA indicator. The Stochastic Oscillators have considerably swerved northbound from the oversold to 23.18 and 28.57, signifying that an uprising motion is imminent in the following sessions.
Can the TAMA/USD market see an extreme reversal movement inside the SMAs’ trending range?
The current volatility in the TAMA/USD trade operation appears not to be backing a sudden presumed aggressive reversal movement against the bigger SMA trend line as the crypto-economic market showcases a lower-rising confluence above a psychological trading support point of $0.02000. The pace of purchases has slowed. And any attempt to cause a dip could replicate the pattern of later giving up to buying at reduction prices.
On the downside of the TAMA/USD technical analysis, sell-off sessions are not to have a smoother stance going by the pace of the uprising from the confluence. Short-position placers would have to be strategic when a volatile motion occurs to a peak zone, warranting a round of rejections before considering part or some buying orders exhausted. But, in the meantime, bears are to stay off until that presumption tends to play out accordingly.
TAMA/USD 1-hour chart
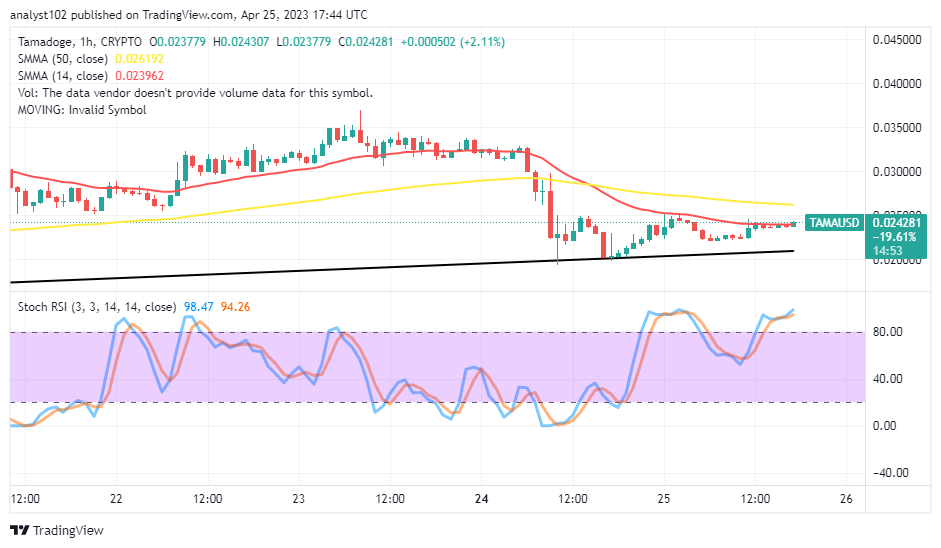
The TAMA/USD 1-hour chart mirrors the crypto market showcasing a lower-rising confluence trading formation from around the support of $0.02000. The 50-day SMA indicator is above the 14-day SMA indicator to identify that the market is still in a reduction zone worthy of buying before a massive gravitational pressure surfaces. The Stochastic Oscillators have swung northbound to give a reading of 94.26 and 98.47 levels in the overbought region. That suggests a slight downside motion may not overrule in the short-term run of the trade shortly.
Forget about Babydoge, TAMA is winning! In the coming days, it will be listed on top CEXs.
https://twitter.com/Tamadogecoin/status/1649022649761136641
Do you want a coin that would 100X in the next few months? That is Tamadoge. Buy TAMA today
Note: Forexschoolonline.com is not a financial advisor. Do your research before investing your funds in any financial asset or presented product or event. We are not responsible for your investing results.


Leave a Reply