Tamadoge Price Prediction, January 13
A significant change has surfaced in the method of how up and down price movements have been showcasing between the market activities of Tamadoge versus the valuation of the US coin, as the transaction line is currently having that the price reverses after a surge to hit a resistance around point of $0.0085, re-energizing hike inputs.
Around the $0.0070 mark, the underlying support line holds steady in the direction of that mode of rising velocities. At the time of writing this analytics article, the dominant price action has been bulls giving in to downward pressure in order to reclaim a path to continue their northward surge within the Bollinger Band indicators.
TAMA/USD Market
Key Levels
Resistance levels: $0.0080, $0.0085, $0.0090
Support levels: $0.0070, $0.0065, $0.0060
TAMA/USD Medium-term Chart
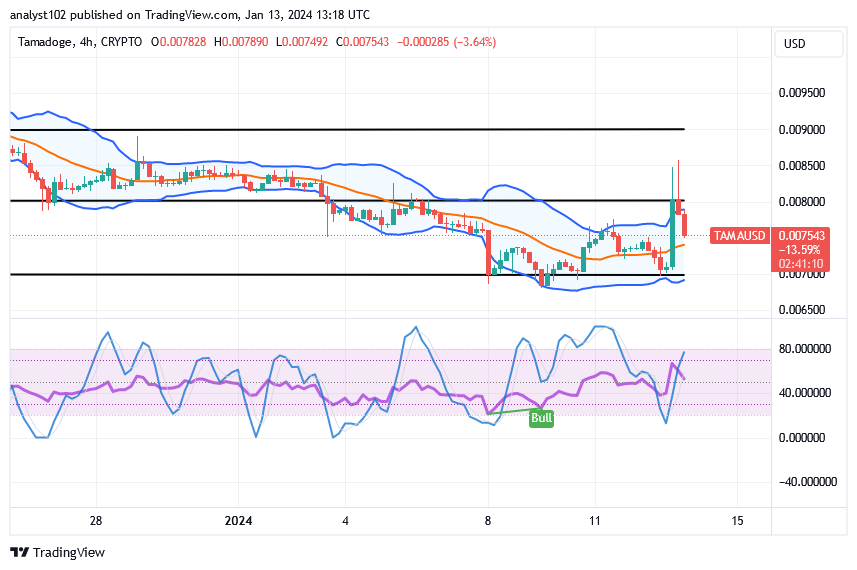
The TAMA/USD medium-term chart reveals that the crypto-economic market reverses after swinging up to $0.0085, re-energizing hike inputs.
The $0.0080 and $0.0070 value lines represent the major trade zones for the up and down price movements that the trade must maintain in order to maintain a long-term, defined cycle. The Bollinger Band trend lines are still positioned around these value lines. The stochastic oscillators have swerved northward closely to the point of 80.
Is placing a long trade order against the current declines in the TAMA/USD market operations optimally technical?
It would be a good manner of approach to buy against most of the falling situations of the TAMA/USD market activities so far within its Bollinger Band environments, given that the base instrument reverses, re-energizing hike inputs as the present report is having them.
Fearful long-position placers on a short-term basis might have to wait for a bullish candlestick to emerge before repurchasing because the market’s velocity pace is now increasing. It is anticipated that investors will now devote the majority of their attention to the market in order to maintain their position accumulation mode.
TAMA/USD short-term chart
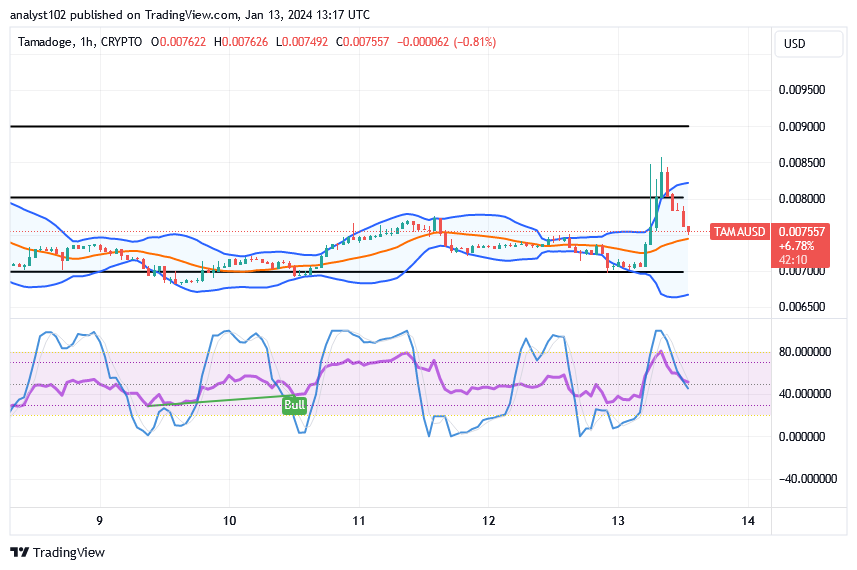
The TAMA/USD short-term chart showcases the crypto market’s reverse subsequence to the condition of hitting a barrier, re-energizing hike inputs.
The top and bottom portions of the Bollinger Band indicators have expanded to fall between $0.0085 and $0.0080 and between $0.0070 and $0.0065, respectively. Currently, the stochastic oscillators are attempting to vividly cross below the 40-point. Further fall-offs are seemingly not going to be allowed in the near future. One or two bullish candlesticks in a row may indicate that upswings are about to resume in real time.
Get your share of TAMA by posting a score on any Tamadoge game today.
The first weekly competitions of 2024 end tonight!
— TAMADOGE (@Tamadogecoin) January 3, 2024
Post a score on any Tamadoge game today and earn your share of $TAMA 👇
📱 Android: https://t.co/D4TjX7gTFl
📱 iOS: https://t.co/0fjJapf5oA pic.twitter.com/HqsHv57gx4
Do you want a coin that would 100X in the next few months? That is Tamadoge. Buy TAMA today
Note:Forexschoolonline.com is not a financial advisor. Do your research before investing your funds in any financial asset or presented product or event. We are not responsible for your investing results.


Leave a Reply