Tamadoge Price Prediction – August 17
Falling transaction activities have continually overshadowed the presence of most rising attempts ever made in the market operations between Tamadoge and the American currency, as the situation signifies that the crypt trade extends a base and is trying to spike despite the condition most of the time.
An emerging trading instrument must exhibit these qualities as it builds up a significant amount of momentum from several lower-trading zones. And that typically takes place in a long-term running mode with a systemically applied compliance strategy that may even result in a process entry that is less recognizable. Overall, the conclusion is still that buying dips should never be discontinued.
TAMA/USD Market
Key Levels
Resistance levels: $0.008500, $0.009000, $0.009500
Support levels: $0.007000, $0.006500, $0.006000
TAMA/USD Medium-term Chart
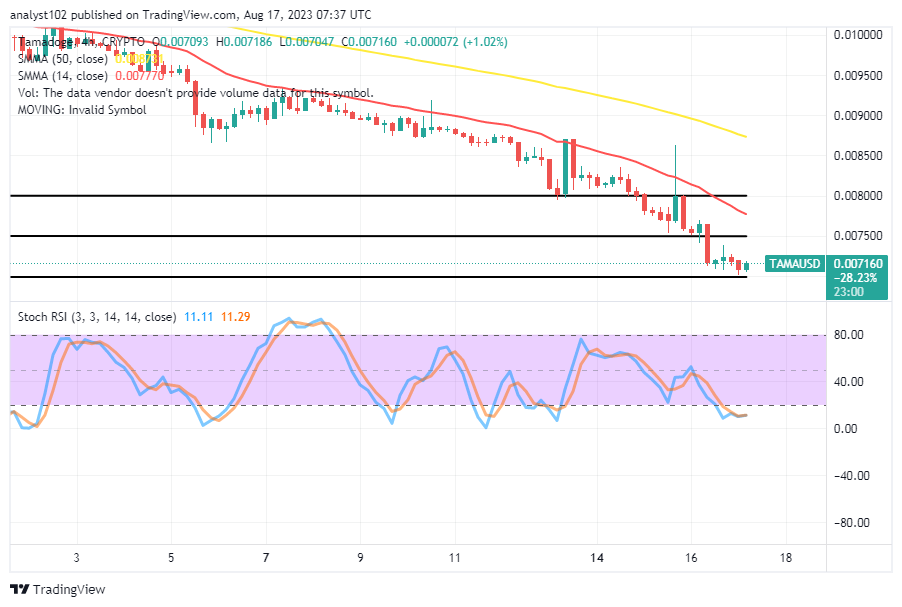
The TAMA/USD medium-term chart showcases the crypto market as it extends a base from $0.007500 to $0.007000, trying to spike from the depth of a significant reduction trading spot that is marking the latest all-time low.
The 14-day SMA trend line has been distancing itself from the 50-day SMA trend line to the south. And they are keeping variant points of $0.007770 and $0.008731, respectively, above the current trading line of $0.007160, which is rated at 1.02% positive. The Stochastic Oscillators have maximally dipped into the oversold region, keeping the values from 11.29 to 11.11, showing that falling forces are gradually losing stance at this material time.
Is it still the best moment to predict stable increases in TAMA/USD market business deals when the SMAs are crossed to the north?
It would be one of the best transaction times to denote reliable recommencement of rises in the operation of Tamadoge against the US coin while the smaller Moving Average has to cross the bigger part to the upside as the crypto trade extends a base, trying to spike from around the level of $0.007000.
Prior to the moves springing upward through resistances below the SMAs, buyers should take further positions at this point of lower trading than they originally accomplished. Between $0.008000 and $0.008500, various psychological barrier points have been set up to prevent the survival of bulls. Therefore, selling actions will quickly be phased out of the cards if they push through them and maintain a long-lasting position above those value lines. 
TAMA/USD Short-term chart
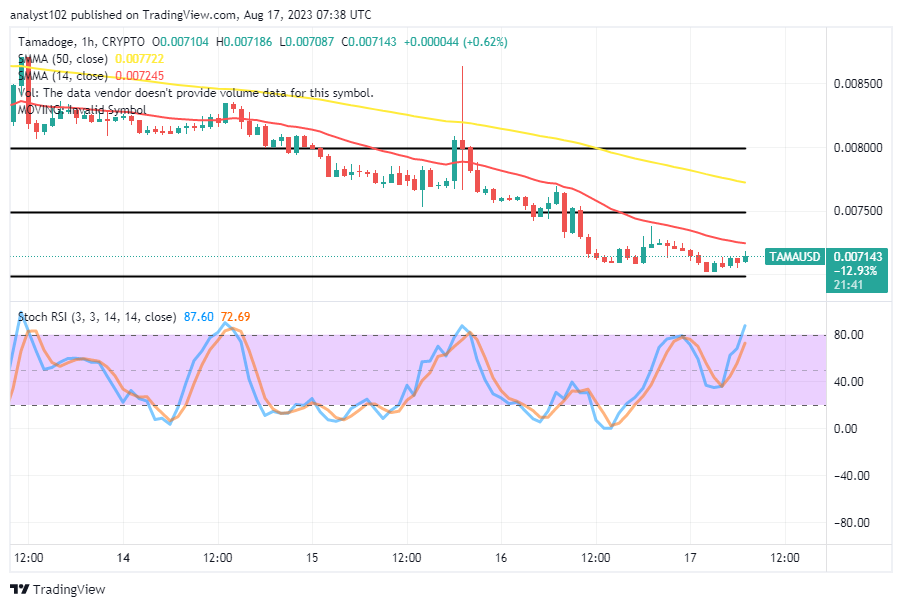
The TAMA/USD short-term chart depicts the crypto trade extending a base from around the line of $0.007500 to $0.007000, trying to spike from it.
A wide space separating the 14-day trend line from the 50-day SMA trend line has been featured. The larger Moving Average indicator is at $0.007722 to pinpoint the cortical resistance trade spot the market will be facing in the short term if the price tends to surge fearfully. The Stochastic Oscillators have been managing to swerve northbound to places between 72.69 and 87.60. That shows purchasing velocity might still exhaust in the near future.
The Tama Army is questioned about their favorite web-based mobile game.
POV: Someone asks the Tama Army what their favourite web3 mobile game is… pic.twitter.com/a8Q3e4SvLs
— TAMADOGE (@Tamadogecoin) August 16, 2023
Do you want a coin that would 100X in the next few months? That is Tamadoge. Buy TAMA today
Note: Forexschoolonline.com is not a financial advisor. Do your research before investing your funds in any financial asset or presented product or event. We are not responsible for your investing results.


Leave a Reply