Tamadoge Price Prediction – September 24
Various routes denote lines of decelerating in the business deals involving Tamadoge versus the US Dollar, given that the crypto-economic trade has compressed energy in recent times after averaging the support of $0.008000 at a close range, rooting for hikes.
A major positive route has been made, bottoming around the support line of $0.008000 for following buying efforts to drive along, according to our technical analysis of a daily chart. Any anticipated scenario in which the market runs back down will trap sellers and result in a long-term loss that was not necessary. Instead, traders had to stick to buying options.
TAMA/USD Market
Key Levels
Resistance levels: $0.009500, $0.01050, $0.01150
Support levels: $0.008000, $0.07500, $0.07000
TAMA/USD Medium-term Chart
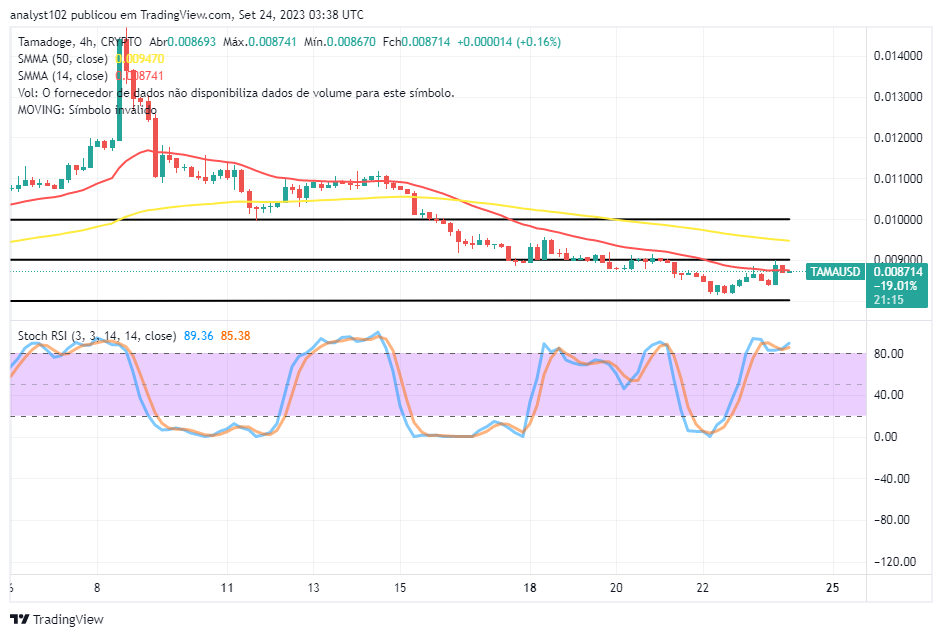
The TAMA/USD medium-term chart showcases the crypto-economic trade compressing energy between the points of $0.009000 and $0.008000, rooting for hikes in the pattern that is currently displaying.
The 50-day SMA indicator is positioned at $0.009470 above the $0.008741 value of the 14-day SMA indicator. Over the past couple of years, the formation of Japanese candlesticks has shown that the price is contending with a barrier of around $0.009000. The stochastic oscillators are in the overbought region, staying at 85.38 to 89.36 to expose that a trait of pushes is relatively ongoing.
Given its existing trade capability, which direction in the TAMA/USD market should be given top priority consideration?
So far, my highly mental inkling in the market activities of the TAMA/USD is that more buying deals should outpace selling thoughts. Given that the crypto trade compresses energy between $0.009000 and $0.008000, rooting for hikes imputes
While the next active motion usually takes shape, there may still be a brief moment when the market shifts back to the south side in an effort to intentionally induce an excessive free fall before pausing or perhaps following it with a rebound to counteract the presence of bears. Long-term investors have the top-notch financial rise expectation to gallop into returns afterwards, regardless of any circumstance signaling a collapse in this developing crypto economy.
TAMA/USD Short-term chart
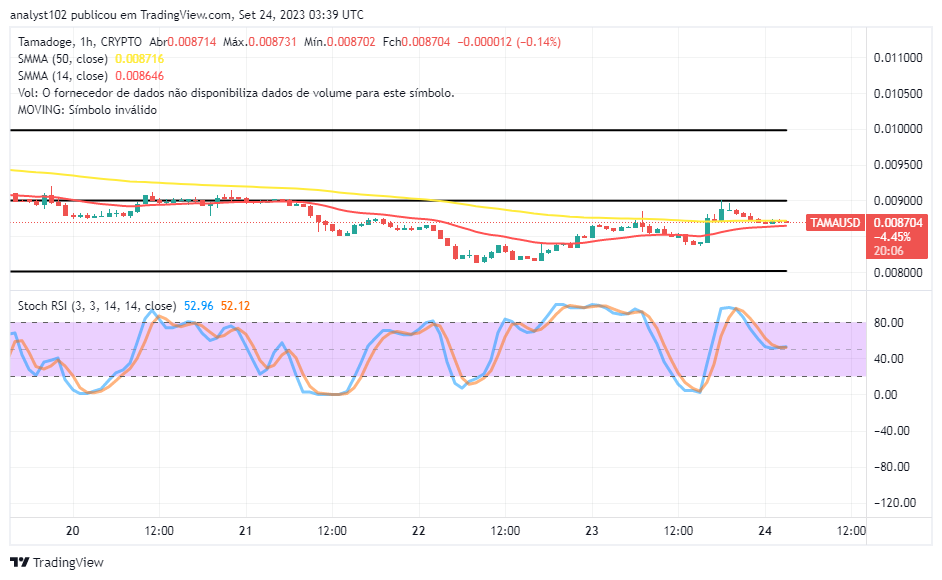
The TAMA/USD short-term chart showcases the crypto trade compressing energy in the range lines of $0.009000 and $0.008000, rooting for hikes.
Readers’ guide on the indicators showcases that the 14-day SMA trend line is at $0.008646 underneath the $0.008716 value line of the 50-day SMA trend line. The stochastic oscillators have managed to reverse southbound briefly from the overbought region, positioning from 52.12 to 52.96. The transaction recommendation or verdict that we are holding still that buying and keeping positives with positions should continue
Get your share of the weekly $TAMA prize pool by earning those weekend top scores.
Get those weekend high scores and claim your slice of the weekly $TAMA prize pool 🎉
— TAMADOGE (@Tamadogecoin) September 23, 2023
Join the action and download Tamadoge Arena now 👇
📱 Android: https://t.co/INCaGenLtC
📱 iOS: https://t.co/Fj9tT5OQ22 pic.twitter.com/PXwcueUKGN
Do you want a coin that would 100X in the next few months? That is Tamadoge. Buy TAMA today
Note:Forexschoolonline.com is not a financial advisor. Do your research before investing your funds in any financial asset or presented product or event. We are not responsible for your investing results.


Leave a Reply