Tamadoge Price Prediction – June 28
The Tamadoge trade compresses down, trying to hold a bounce closely below the trend line of $0.01400.
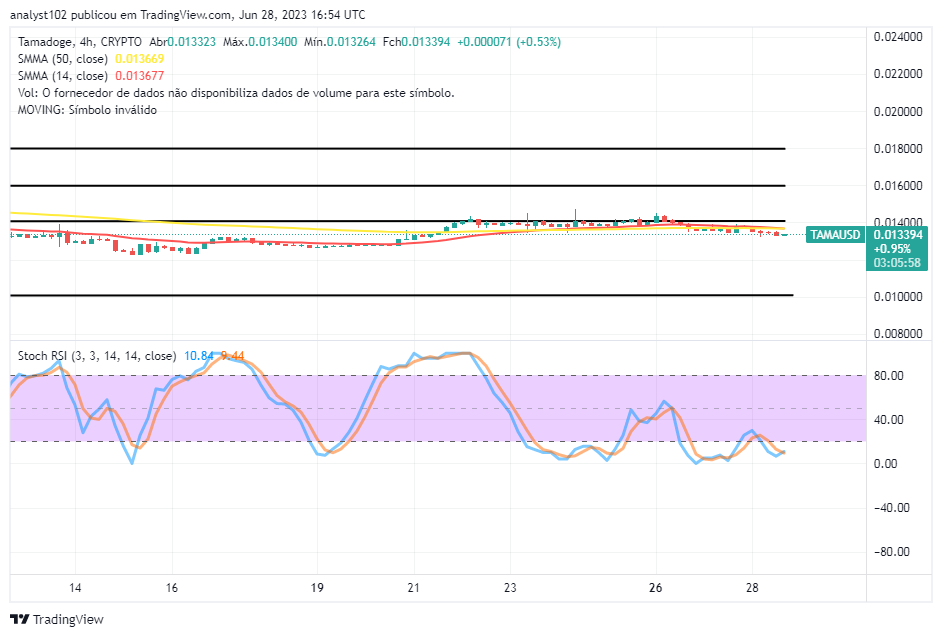
Exchange of hands has been featured between $0.013400 and $0.013264 value lines at an average minute positive percentage rate of 0.53. The trade situation still appears to be that long-position placers will continue to look for decent buying orders to be executed to eventually produce rebounds to cover up for profits in a sequential running manner as the $0.01200 support will keep underneath for the long term.
TAMA/USD Market
Key Levels
Resistance levels: $0.01500, $0.01600, $0.01700
Support levels: $0.01200, $0.01100, $0.01000
TAMA/USD – 4-hour Chart
The TAMA/USD 4-hour chart showcases the crypto-economic trade compressing down, holding a bounce psyche closely beneath the trend lines of the SMAs.
The 14-day SMA indicator has trended to keep $0.013677 above the $0.013669 value point of the 50-day SMA indicator. The upper horizontal line is drawn at $0.01400, and the lower horizontal line is at $0.01200. The Stochastic Oscillators have been positioned at 9.44 to 10.84, slightly showing that the price is getting set for an upside run.
Will the TAMA/USD market continue to trade at a discount below the $0.014 upper range point of resistance?
There might be some delay trade systems to portray that some shifts to the down side might be achieved to cause an unnecessary further panic sell-off condition as the trade compresses down, holding a bounce in its technical point of view.
The push operation in the TAMA/USD price has been wallowing in some dipping trade zones over time to allow investors the opportunity to make comebacks at reduced prices. That said, buyers are enjoined to continue to exercise patience as a chain of lower lows might still relatively predominate the trade arena between the $0.01400 and $0.01200 lines ahead of the resumption of booming cycles.
TAMA/USD 1-hour chart
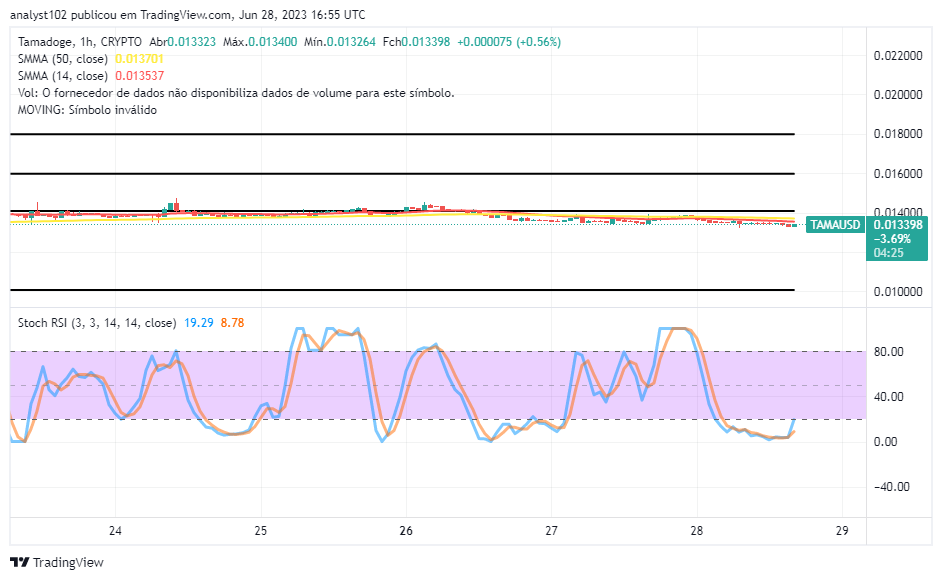
The 1-hour chart showcases the crypto-economic trade compressing down slowly, holding bounce signs on most of the trading indicators.
The arrangement of the indicators reveals the locations of the $0.013537 and $0.013701 value lines, by which the 14-day and 50-day SMAs have maintained an easterly trajectory. The stochastic oscillators have been moving closely in the oversold area to the point where they are simultaneously attempting to cross back to levels of 8.78 and 19.29. That suggests that a less-active gravity has been building up to push the market situation in an upward direction.
When should you top off your $TAMA?
Is it time to top up your $TAMA? 👀
— TAMADOGE (@Tamadogecoin) June 28, 2023
We’ve got you covered 💸 https://t.co/KONwEq5Glw#Tamadoge #memecoin pic.twitter.com/TCJOjd5jCn
Do you want a coin that would 100X in the next few months? That is Tamadoge. Buy TAMA today
Note: Forexschoolonline.com is not a financial advisor. Do your research before investing your funds in any financial asset or presented product or event. We are not responsible for your investing results.


Leave a Reply