Tamadoge Price Prediction – June 21
The TAMA/USD prices slouch sideways, striking for a rise within the confinement trade zones of $0.01400 and $0.01200, as the opinion toward achieving a sustainable increment in the crypto’s economy is gaining northward momentum.
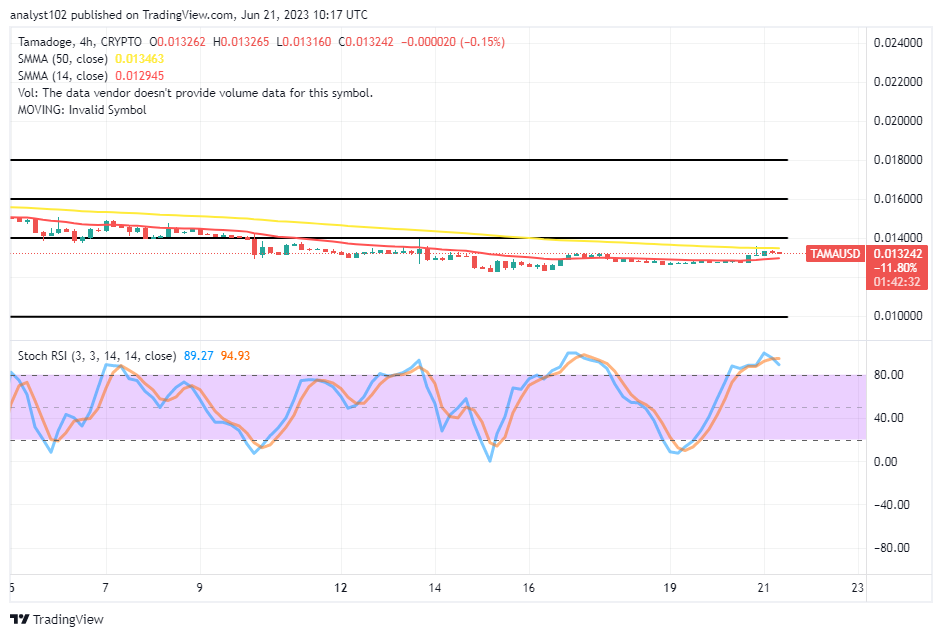
At the time of this technical piece, transaction operations between buyers and sellers have been at a high of $0.013265 and a low of $0.013160, maintaining an average negative percentage rate of 0.15. The price motion to the moon side has been gradually losing weight toward staging a re-buying moment in the major points specified above.
TAMA/USD Market
Key Levels
Resistance levels: $0.01400, $0.01500, $0.01600
Support levels: $0.01200, $0.01100, $0.01000
TAMA/USD – 4-hour Chart
The TAMA/USD 4-hour chart shows that the crypto-economic prices slouch sideways, striking for a rise against the American coin around the trend lines of the SMAs. The 14-day SMA indicator is at $0.012945, below the $0.013463 value line of the 50-day SMA indicator. The Stochastic Oscillators have traversed northbound into the overbought region to place back southbound at 94.93 to 89.27 levels. It shows the cryptocurrency may shift down soon.
Will buyers soon surpass the $0.01400 barrier, given the present trade velocity in the TAMA/USD market operation?
The TAMA/USD market buyers may still be taking their time before breaking through the $0.01400 resistance, as it has noticed that prices slouch sideways, striking for a rise presently.
In the spirit of standardizing buying analytics in this crypto business operation, long-position placers should be strategic enough to follow any slight opportunity that indicates an upcoming increase in the index between the value lines of $0.01200 and $0.01400. The continuation of a bullish trend will be confirmed if the 14-day SMA crosses the 50-day SMA to the north side. That is something that buyers should keep in mind.
TAMA/USD 1-hour chart
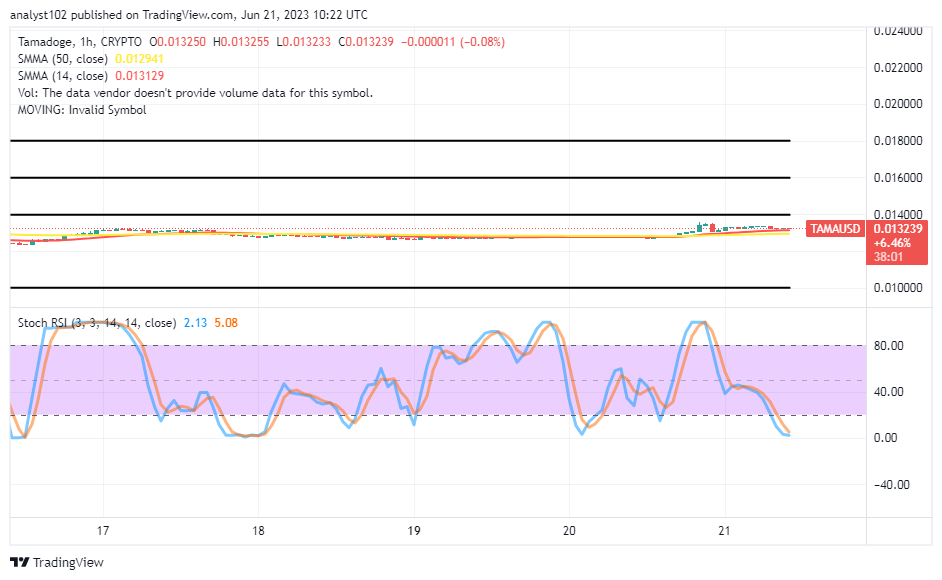
The 1-hour chart showcases the crypto-economic prices slouching sideways, striking for a rise closely below the resistance level of $0.01400 over the trend lines of the trading indicators.
The arrangement of the 14-day and the 50-day SMA indicators showcases that trade activities have persistently featured in the well-defined range values. The Stochastic Oscillators have dipped into the oversold region at 5.08 to 2.13 levels. A line of lower lows will prevail toward the previous support at $0.01200 if the succeeding condition results in a consolidation movement mood. Investors should, however, steadfastly adhere to the longing trade myth.
All new users receive 20 free credits to level up!
Level UP with 20 free credits for all new players!
— TAMADOGE (@Tamadogecoin) June 21, 2023
Sign up here 👉 https://t.co/IWYl78XAUy pic.twitter.com/Xd1qqCkoPf
Do you want a coin that would 100X in the next few months? That is Tamadoge. Buy TAMA today
Note: Forexschoolonline.com is not a financial advisor. Do your research before investing your funds in any financial asset or presented product or event. We are not responsible for your investing results.


Leave a Reply