Tamadoge Price Prediction – June 19
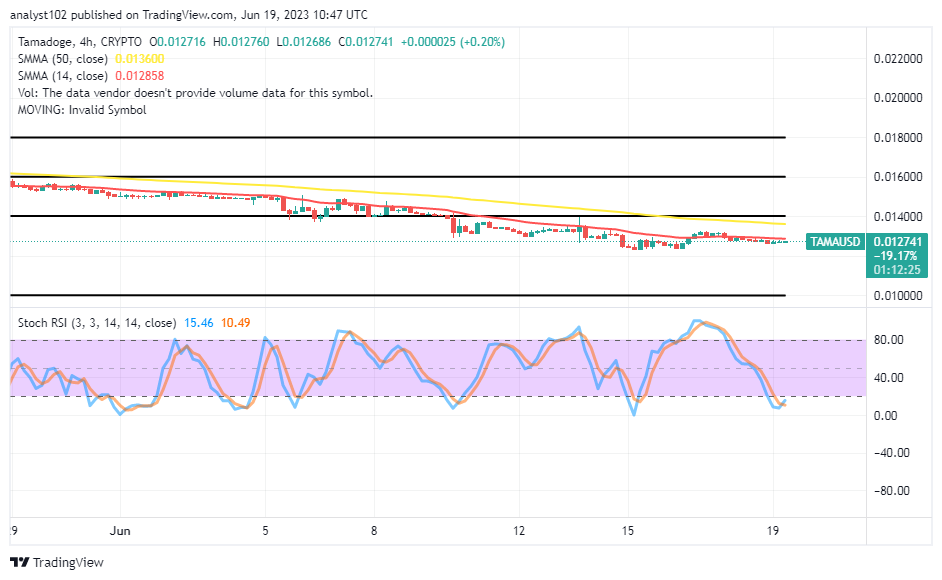
A closure technical trade outlook has established that the market operations in the Tamadoge coin against the US Dollar prices positioned over the $0.01200 line in the last couple of days, making bounces with lesser effects through the resistances. As of this analytics piece, up and down business activities have only zoned between $0.012760 and $0.012686 value lines at a minute average rate of 0.20%. The buying and holding strategy that is excellent for dip transactions ahead of the anticipated, violent rising periods is still justified.
TAMA/USD Market
Key Levels
Resistance levels: $0.01500, $0.01600, $0.01700
Support levels: $0.01200, $0.01100, $0.01000
TAMA/USD – 4-hour Chart
The TAMA/USD 4-hour chart shows that the crypto-economic prices positioned over the $0.01200 support level, making bounces that are yet to generate aggressive motions to break through the overhead resistances. If buyers fail to step up efforts to get past the $0.01500 resistance level, which has been marked down by the indicators, there may be continuity in the pushing myth of losing back to the downside. The 14-day SMA trend line is continually trending alongside the formation of the trading candlesticks, portending a threat of depression below the $0.013600 value line of the 50-day SMA trend line. The Stochastic Oscillators are in the oversold region, slightly maintaining 10.49 to 15.46 levels on the north side. That signifies a flimsy rise is going on.
Will limit buy orders play a good instrumental role now in the TAMA/USD market?
As there have been several observations that some technical indexes have produced much loss of momentum gathering systemically at a low pace in the TAMA/USD market activities, it would be okay to most of the time use the buy limit order trait, given that the crypto prices positioned over the $0.01200 support level, making bounces toward the point to invalidate further subtle declines. In addition to that psychological projection, the reading scenario that is portending that the Stochastic Oscillators have put them in the oversold condition, might not be played with, especially when the daily and 4-hour charts have been spotted to be having a complimentary outlook to launch back an immediate yearning order position.
TAMA/USD 1-hour chart
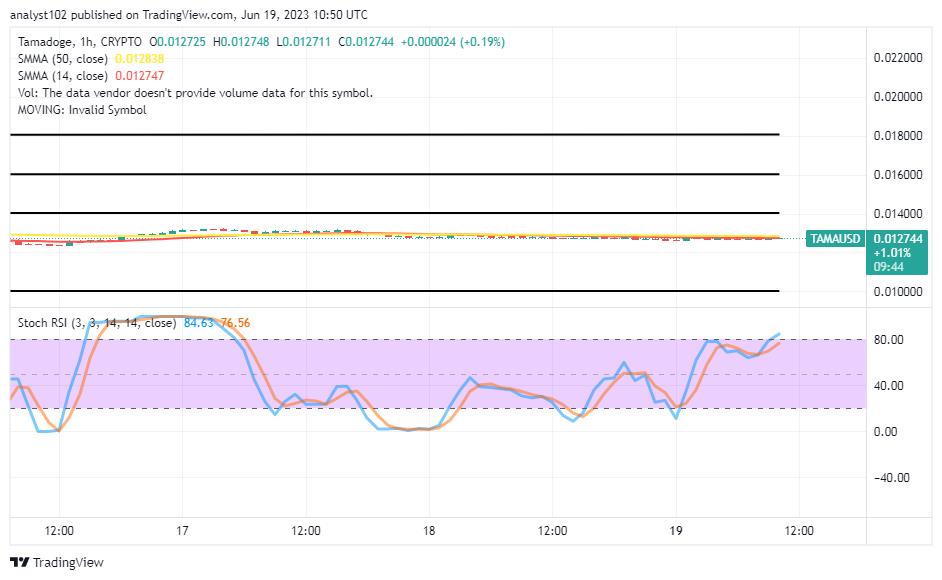
The 1-hour chart showcases the crypto-economic prices positioned over the $0.01200 support trading spot. The 14-day SMA trend line and the 50-day SMA trend line are pointing eastward around the $0.012747 and $0.012838 points, respectively. The Stochastic Oscillators have swung toward the 76.56 and 84.63 levels. The market may shift down to a support level around $0.01200 before gathering momentum to rise upward,
When all you want is a genuine P2P gaming encounter…
When all you need is a real P2E gaming experience… #Tamadoge #web3 #P2E pic.twitter.com/8g3DQHC7Uo
— TAMADOGE (@Tamadogecoin) June 19, 2023
Do you want a coin that would 100X in the next few months? That is Tamadoge. Buy TAMA today
Note: Forexschoolonline.com is not a financial advisor. Do your research before investing your funds in any financial asset or presented product or event. We are not responsible for your investing results.


Leave a Reply