Tamadoge Price Prediction – April 21
As there has been an upsurge producing fearless breaking through of resistances recently in the TAMA/USD market operation, the situation has now changed as the crypto-economic prices face a retracement process. The percentage rate of trading is noted at 23.22 negatives when this technical analysis has been gathering, sounding a caution to upward-placing traders about the potential of losing some profits if not cashed out before the correction course escalates.
TAMA/USD Market
Key Levels
Resistance levels: $0.03500, $0.04000, $0.04500
Support levels: $0.01500, $0.01250, $0.01000
TAMA/USD – Daily Chart
The TAMA/USD daily chart reveals the crypto’s prices facing a retracement process shortly after the trade surged past the resistance of $0.03500. The 50-day SMA indicator is at the $0.015254 point and is barely ahead of the 14-day SMA indication at the $0.015845 value line. And they are below where the trading is happening right now. The Stochastic Oscillators are in the overbought area, maintaining 92.21 and 83.60 levels, indicating the rate at which the base trading instrument has lost its ability to move in one direction or another.
What percentage of a retracement may the TAMA/USD market make before trying an upward swing?
Going by the current capacity at which the TAMA/USD market retraces over the trend lines of the SMAs, the downward transmission could, in the long run, lead to finding support around the indicators’ values as it noticed the crypto-economic prices face a retracement process at the moment. It will be another round of buying at lower prices to make room for new long-position placers. Investors should abandon the idea of enjoying panic sell-offs based on the worth value of an emerging trending coin at all levels.
On the downside of the TAMA/USD technical analysis, Sellers may have to put their shorting position orders under a protective stop loss order between or around the resistance points of $0.03500 and $0.04000. The extension of the Stochastic Oscillators from their present positions to lower ones will signify that occurrence of lows has come to stay for a specific session that could pose a risk of continuing to go on shorting sprees freely.
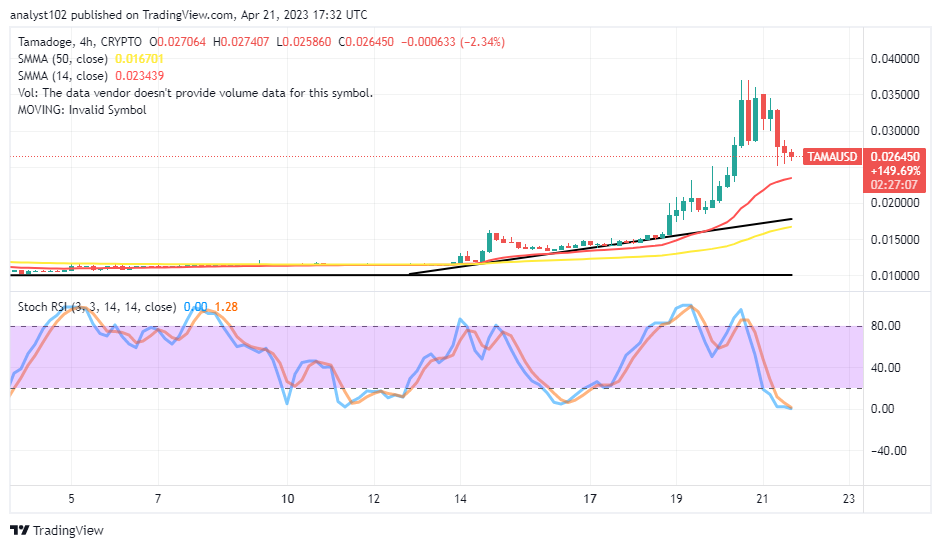
TAMA/USD 4-hour chart
It is also on the 4-hour chart that the crypto-economic prices face a retracement process after a surging path, leading to obtaining a peak point around the resistance of $0.03500. A bearish candlestick is in the making toward the trend line of the smaller SMA. The 14-day SMA indicator is above the 50-day SMA indicator with a space separating them. The Stochastic Oscillators have dipped into the oversold region to 1.28 and 0.00 levels. That could either lead to a condition of witnessing a pause or some lower lows soon. Nevertheless, buyers should continue during an upward reversal moment based on an ideal tactical-trading myth.
Forget about Babydoge, TAMA is winning! In the coming days, it will be listed on top CEXs.
https://twitter.com/Tamadogecoin/status/1649746125862125568
Do you want a coin that would 100X in the next few months? That is Tamadoge. Buy TAMA today
Note: Forexschoolonline.com is not a financial advisor. Do your research before investing your funds in any financial asset or presented product or event. We are not responsible for your investing results.


Leave a Reply