Tamadoge Price Prediction – May 29
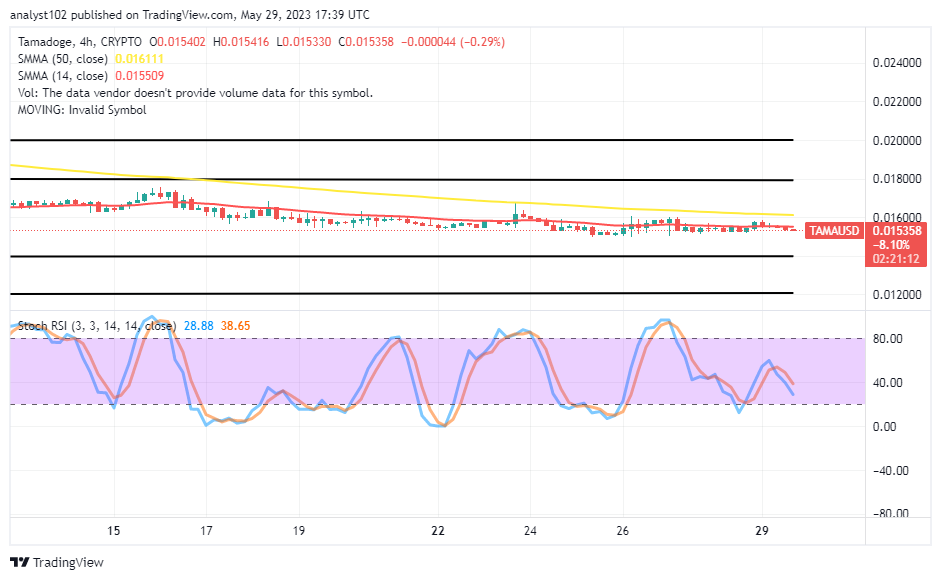
Even though some declines have also been playing out in the TAMA/USD trade operations, the crypto-economic prices are constantly looking for a rebound. The rate of the market’s percentage is at 0.29, leaving to trade between minor space lines of $0.015416 and $0.015330. It is technically desirable for long-position placers to significantly outweigh any other definitive direction in the long-term run relative to its transaction zones at this time, regardless of how long the current sideways trade lasts.
TAMA/USD Market
Key Levels
Resistance levels: $0.01750, $0.01850, $0.01950
Support levels: $0.01400, $0.01300, $0.01200
TAMA/USD – 4-hour Chart
The TAMA/USD 4-hour chart reveals that crypto-economic prices are constantly looking for a rebound around the trend line of the smaller trading indicator in the last several days, running into some weeks now. The 14-day SMA indicator is at $0.015509, beneath the $0.016111 value of the 50-day SMA indicator. The Stochastic Oscillators are at 38.65 to 28.88, following a southbound-crossing mode they made from around the 60 level. That means the base trading instrument’s valuation will be shift to the downside before reclaiming its stances.
Will sellers have an advantage shortly based on how long the TAMA/USD market has been moving around the 14-day SMA?
Mentally speaking, it is unethical to project further sustainable fall-offs in the TAMA/USD market operations below the capacity of the 14-day SMA, as the crypto-economic prices are constantly looking for a rebound. The resumption of the presumed upward trending sessions will be forthcoming when least expected, given most of the Stochastic Oscillators have traversed southbound to complete the moments of breaking through some levels to the lower zone to point back to the north. Nonetheless, investors who have not bought into this crypto economy still have a better chance to do so because the projected bounce-off happenings will happen unprecedentedly in no time.
TAMA/USD 1-hour chart
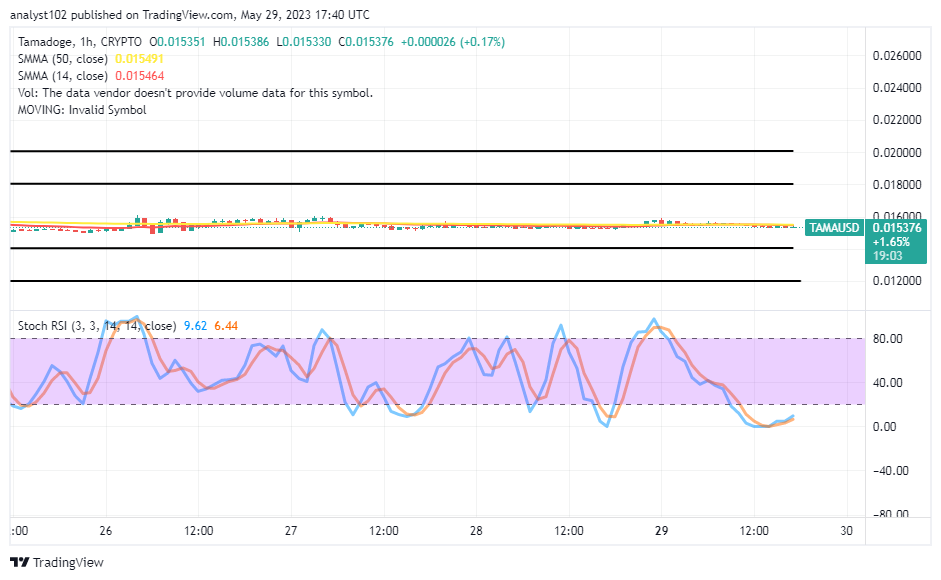
The 1-hour chart showcases the crypto-economic markets are constantly looking for a rebound around the conjoined eastward-trending path of the indicators. Both the 14-day SMA trend line and the 50-day SMA trend line are seen closely beneath the $0.01600 resistance line. The Stochastic Oscillators have dipped into the oversold region to make a slight northbound-crossing mode at 6.44 to 9.62 levels. The positioning of the Oscillators will play a significant role in predicting when the market will reshape its points and take a new attitude.
Forget about Babydoge, TAMA is winning! In the coming days, it will be listed on top CEXs.
Do you want a coin that would 100X in the next few months? That is Tamadoge. Buy TAMA today
https://www.forexschoolonline.com/tamadoge-tama-usd-prices-are-constantly-looking-for-a-rebound/
Note: Forexschoolonline.com is not a financial advisor. Do your research before investing your funds in any financial asset or presented product or event. We are not responsible for your investing results.


Leave a Reply