Tamadoge Price Prediction – May 26
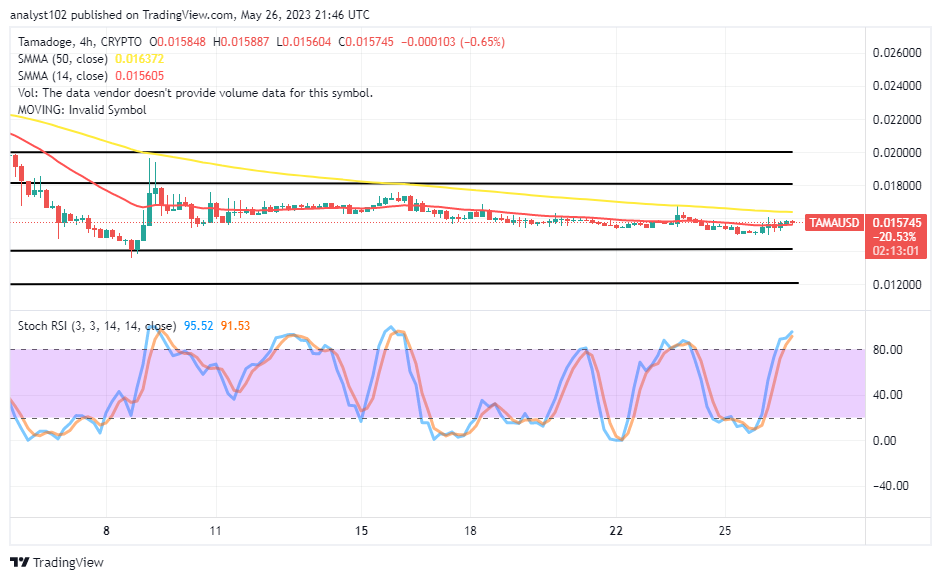
The variant trading activities between buyer and seller in the TAMA/USD market portend that the crypto-economic prices are attempting to hike their valuation. Over time, shorting moments are made afloat over the psychological support level of $0.01500 as the market’s zones are between $0.015887 and $0.015604 lines at an average minute negative percentage rate of 0.65. In the meantime, long-position takers might not be surging their paces out of the current zone. However, the likelihood that the cryptocurrency will eventually trade against the US dollar is increasing daily.
TAMA/USD Market
Key Levels
Resistance levels: $0.01800, $0.01900, $0.02000
Support levels: $0.01400, $0.01300, $0.01200
TAMA/USD – 4-hour Chart
The TAMA/USD 4-hour chart reveals that crypto-economic prices are attempting to hike their trade worth from the lower spot. The 50-day SMA trend line is $0.016372 above the 14-day SMA trend line, which is $0.015605. A crucial zone for the $0.01500 has been by the horizontal line drawn at the $0.01400. The overbought region’s Stochastic Oscillators are at 91.53 and 95.552. As for this technical piece, the assessment of the overall signs shows that purchasers should exercise caution before joining the motion.
Will the TAMA/USD market sellers reclaim positions under the 50-day SMA trend line?
Like being a psychological trade phenomenon, bulls in the TAMA/USD market operations will likely lose stances in a manner of slightness around the trend line of the 50-day SMA as it is even that the crypto-economic prices are attempting to hike in no time. The movements so far have been showing a prominent promissory spiraling signal that is sound enough against getting a decent shorting entry order. The trade value points between $0.01500 and $0.01400 will serve the critical base zones in the event of any need for the trade to devaluate fearfully in no time.
TAMA/USD 1-hour chart
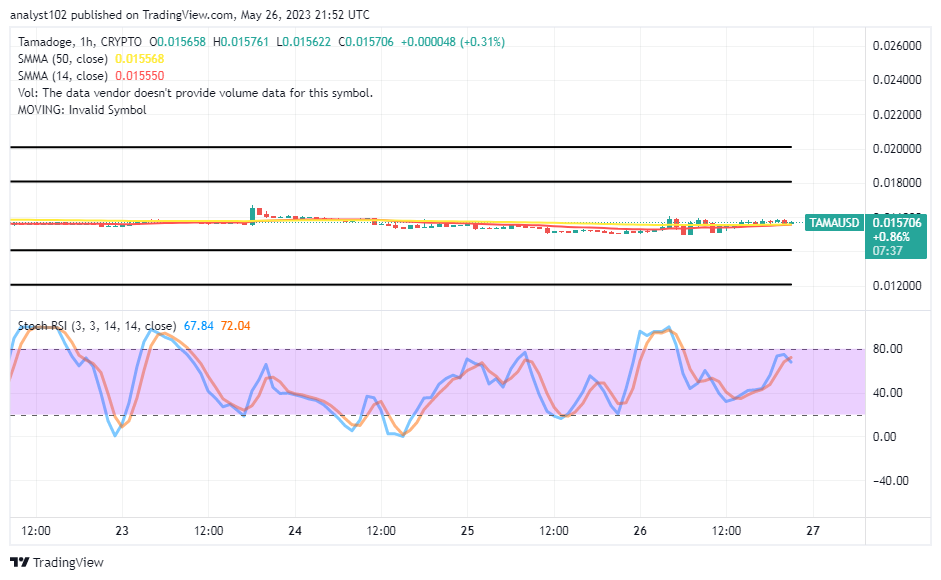
The 1-hour chart for TAMA/USD shows that the conjoined SMA trend lines are attempting to support a hike in the crypto-economic pricing. The 50-day SMA indicator and the 14-day SMA indicator are flatly toward the east, between $0.01500 and $0.01600. At 72.04 to 67.84, the stochastic oscillators have marginally crossed southward. Buyers should continue to hold fast to their yearning for their positions.
Forget about Babydoge, TAMA is winning! In the coming days, it will be listed on top CEXs.
Do you want a coin that would 100X in the next few months? That is Tamadoge. Buy TAMA today
Note: Forexschoolonline.com is not a financial advisor. Do your research before investing your funds in any financial asset or presented product or event. We are not responsible for your investing results.


Leave a Reply