sTamadoge Price Prediction, March 20
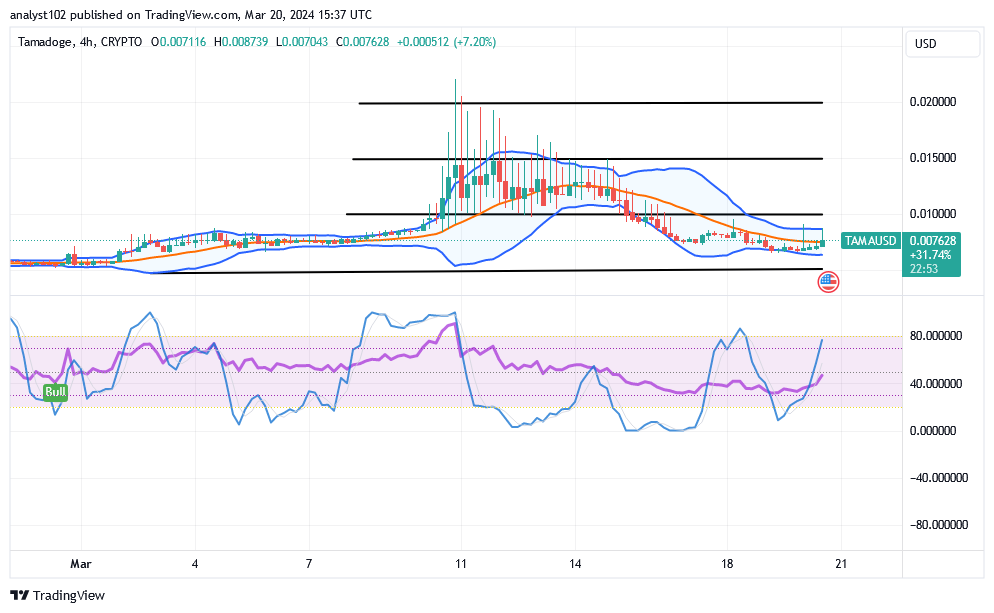
Trade operations that are characterizing the ability of bears against the presence of bulls in the TAMA/USD market have reached a maximal reduction point, given that the crypto-economic price waves low, rebuilding a rise sign from around the lower Bollinger Band.
Notably, the upward-growing velocity rate has been speculating about maintaining steady increases across the board. The introduction of finances must start with that supposition in mind. If selling activity seems to be returning, it could be because the price is vulnerable to rejections, particularly in the upper Bollinger Band.
TAMA/USD Market
Key Levels
Resistance levels: $0.010, $0.012, , $0.014
Support levels: $0.006, $0.005, $0.004
TAMA/USD Medium-term Chart
The TAMA/USD medium-term chart showcases the crypto-economic price waves low, rebuilding a rise sign.
The stochastic oscillators have been positioned in a northbound-swerving mode across some points close to the area of 80. The Bollinger Band trend lines have been placed slightly downward at the values of $0.010 and $0.005. A note-worthy pattern of candlestick formation has been enforcing around the buy signal side of the lower Bollinger Band.
What trending exchanger is the price trying to crate presently as the TAMA/USD market trades around $0.007628′?
A trace of sideways movement is relatively present around the areas of the middle and lower Bollinger Bands as the TAMA/USD market waves low, rebuilding a rise sign.
It would seem logical for traders holding long positions to enter the market a few points ahead of any consistent upward trend, as the range-bound trending method has noted. The underlying horizontal line drawn at $0.005 is serving as a firm base that the market might not try to touch before bouncing back upward, according to a closing technical trade method.
TAMA/USD short-term chart
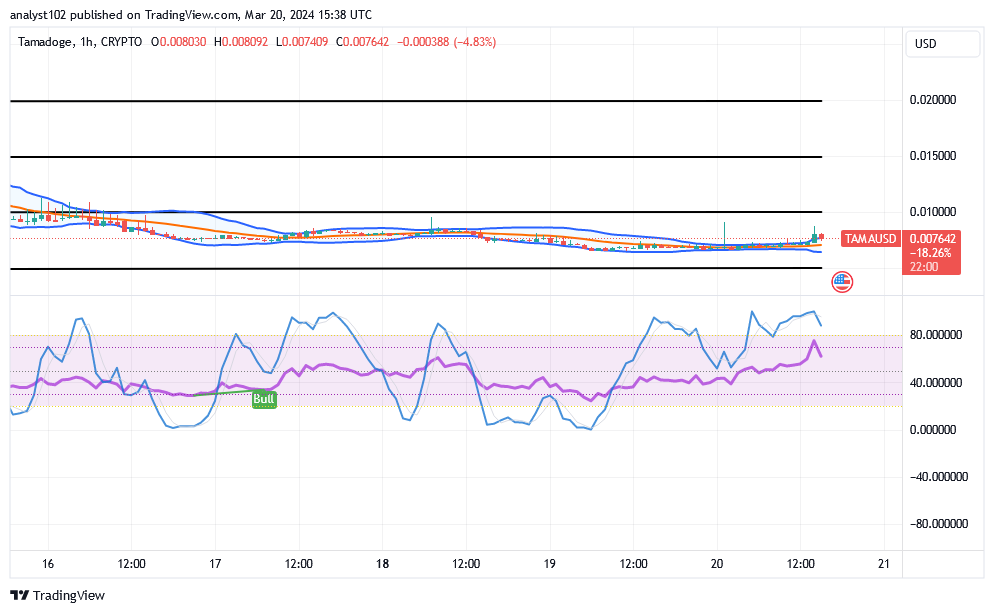
The TAMA/USD short-term chart reveals that the crypto-economic price waves are low, rebuilding a rise sign around the indicators.
A slight swerve towards the north has been observed by the stochastic oscillators across certain levels, causing them to penetrate certain areas of the overbought region. The Bollinger Band signs, which show that a gain is going to occur, have stretched eastward at $0.010 and $0.005. As a result, from this point on, more yearning position orders than selling orders should control the market.
An organized attack was made on the Tamadoge developer wallet. By taking advantage of a contract flaw, the hackers gained access to the Tamadoge liquidity pool.
The Tamadoge developer wallet was targeted as part of a coordinated attack. By taking advantage of a contract vulnerability, the hackers gained access to the Tamadoge liquidity pool. 🧵 pic.twitter.com/ciVaWyNEx1
— TAMADOGE (@Tamadogecoin) January 25, 2024
Do you want a coin that would 100X in the next few months? That is Tamadoge. Buy TAMA today
Note: Forexschoolonline.com is not a financial advisor. Do your research before investing your funds in any financial asset or presented product or event. We are not responsible for your investing results.


Leave a Reply