Tamadoge Price Prediction, November 29
Demonstrations of price actions by the Tamadoge market bulls versus the valuation of the US Dollar have been majorly held on a base of $0.008000, as the crypto trade touches the point of $0.008500 severally, opting for a bounce signal.
Without a doubt, during the past few hours, buying and selling activity has consistently been seen in the vicinity of $0.008500 and $0.00800, allowing the accumulation of the former instrument to be purchased at a relatively reduced monetary value ahead of the significant forces that are anticipated to rise in the upcoming operational days. Buyers and investors would have to hold onto their positions for a while at the trade zones between the middle and lower lines.
TAMA/USD Market
Key Levels
Resistance levels: $0.009000, $0.009500, $0.01000
Support levels: $0.007500, $0.007000, $0.006500
TAMA/USD Medium-term Chart
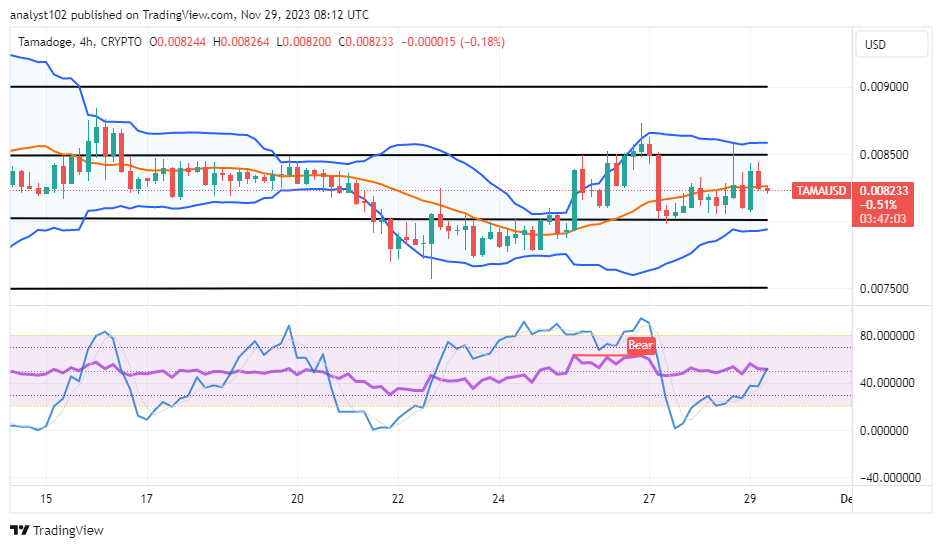
The TAMA/USD medium-term chart reveals the crypto-economic trade touches the line of $0.008500, opting for bounced inputs.
Such a situational arrangement is extracting the need for buyers to resume steady rises, which is in the pipeline as the Bollinger Bands are made to position practically around the values of $0.008500 and $0.00800. The stochastic oscillators are tentatively positioned northbound from the blue, spanning from the oversold region briefly past the point of 40.
Is it prudent for buyers to hold off till the TAMA/USD market declines under $0.007500 once more?
Be it up or down motion in the Bollinger Band confinements, the TAMA/USD market still possesses a good buy order, given the crypto-economic price touches the point of $0.008500, opting for bounces from the zone of $0.00800.
It is recommended that long-term fund committers stick to their methodological trading ideas because the price valuation of the cryptocurrency economy is still much below even a $1 line. Investors would therefore need to exercise patience in advance of sharply increasing northward velocities. In the upcoming months, as 2023 draws to a close, only time will tell.
TAMA/USD short-term chart
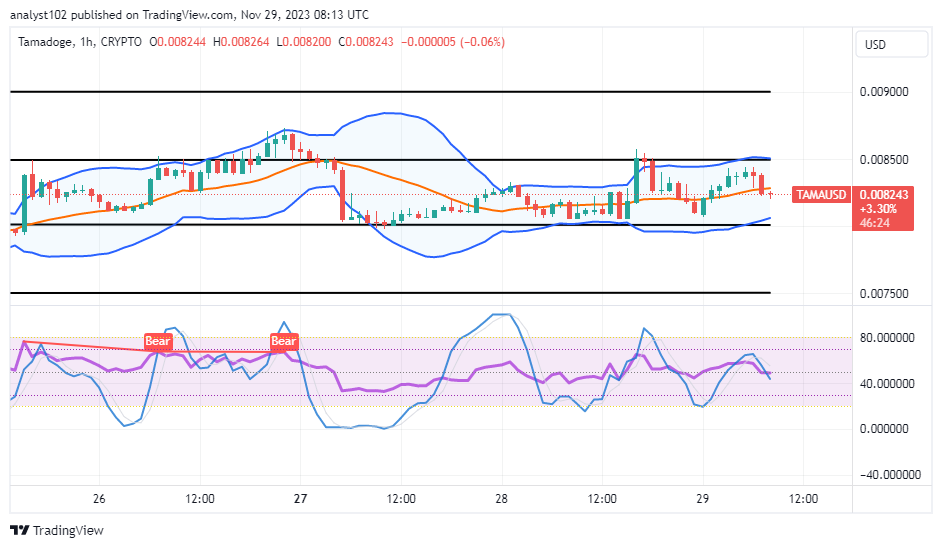
The TAMA/USD short-term chart showcases the crypto trade touching the value of $0.008500, trading against the worth of the USD currency, opting for bounces.
The majority of the time, the hourly stochastic oscillators have been swerving, creating a pattern of swinging up and back around the line of 20. Additionally, they are not staying in the oversold area for as long before deepening the blue line and going north to signal the impending purchase order. The Bollinger Bands are systemically positioned northward, giving the ideal longing entry from the lower ends of the indicators. As a result, investors’ positioning orders continue to move in a positive direction.
Now on Tamadoge Arcade, try Tamadoge Run.
Earn $TAMA playing classic arcade games 💪
— TAMADOGE (@Tamadogecoin) November 29, 2023
Try Tamadoge Run now on Tamadoge Arcade 👇
📱 Android: https://t.co/3PXpfUAM0J
📱 iOS: https://t.co/UN5MlRGh44 pic.twitter.com/BHxxK66LrK
Do you want a coin that would 100X in the next few months? That is Tamadoge. Buy TAMA today
Note:Forexschoolonline.com is not a financial advisor. Do your research before investing your funds in any financial asset or presented product or event. We are not responsible for your investing results.


Leave a Reply