Tamadoge Price Prediction – July 26
There has been a long-holding trade situation in the TAMA/USD market that is making the crypto-economic price continue to test some supports built around $0.01000, pushing for higher proficiency signs.
A long-position holder must maintain maximum presence above and around the trade point in question in order to continue the methods supporting an outright replication of successive buying sprees. Investors should never lose hope that their positions, regardless of level, will ultimately produce enormously positive results over the long term.
TAMA/USD Market
Key Levels
Resistance levels: $0.01200, $0.01400, $0.01600
Support levels: $0.01000, $0.00900, $0.00800
TAMA/USD Medium-term Chart
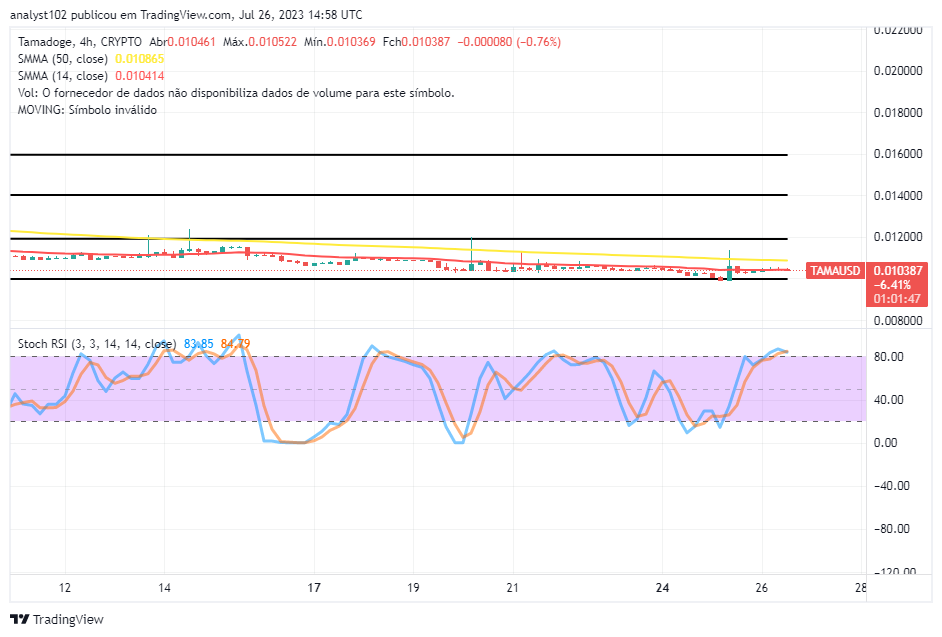
The TAMA/USD 4-hour chart showcases that the crypto-economic price continues to test supports around $0.01000, pushing for hikes within the values of $0.01200 and $0.01000.
There has been little difference in positioning between the trending indicators of the 14-day and the 50-day SMAs. The smaller Moving Average line is closely beneath the bigger Moving Average. The Stochastic Oscillators have slightly crossed southbound in the overbought region from 84.79 to 83.85 points, denoting that a shift or a pause condition might soon crop up to allow for another round of testing the support line of around $0.01000.
Will the TAMA/USD market operations suffer further losses after the $0.01000? If so, what should traders do?
As long as the TAMA/USD market transaction has come to stay in the world of crypto economies, given that it is in its nascent stage of emerging, its continuality to test supports around $0.01000 and pushing for hikes will mostly reproduce northward rises in the long-term run.
The price has significantly declined systemically to one of the best window opportunities to stage buy from the dips strategy. Prior to clicking the buttons for making decisions, it must follow tradition and pay close attention to how the stochastic oscillators are reading. And the majority of judgments involve buying something in opposition to numerous other ideas or considerations. 
TAMA/USD Short-term chart
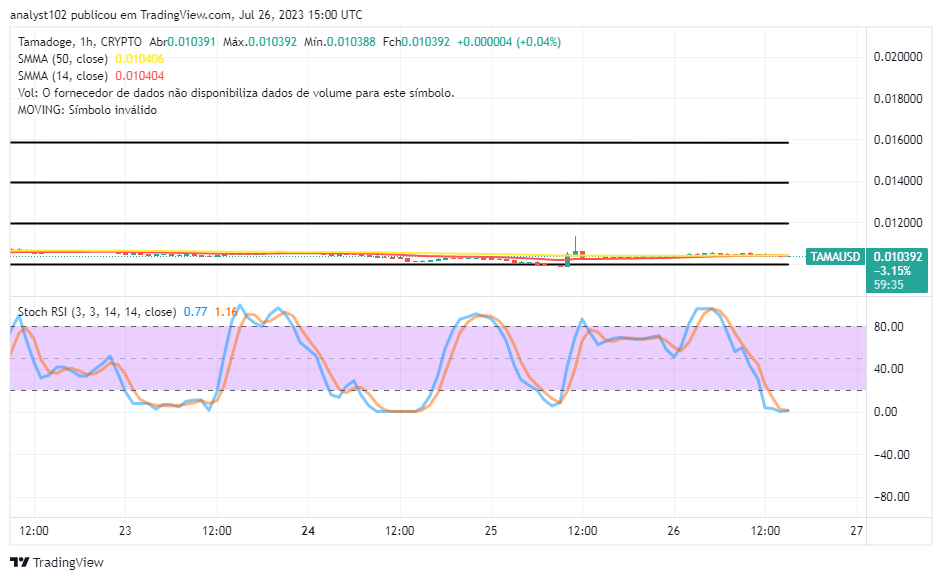
The TAMA/USD short-term chart showcases the crypto-economic price continuing to test around the support of $0.01000, pushing for hikes.
The horizontal line created at $0.01000 continues to climb nearly above the 14-day SMA and the 50-day SMA indicators. The stochastic oscillators have moved from the overbought zone to the oversold region in a southerly direction, maintaining a range of 1.16 to 0.77. This implies that purchasers should carefully position themselves before launching a large order.
Before the leaderboards reset at 11:59 p.m. UTC TODAY, climb those lists.
It sneaks up on us every week, Tama Army!
— TAMADOGE (@Tamadogecoin) July 26, 2023
Climb those leaderboards before 11:59pm UTC TONIGHT before they reset 🙃 pic.twitter.com/NEfaiYoVW9
Do you want a coin that would 100X in the next few months? That is Tamadoge. Buy TAMA today
Note: Forexschoolonline.com is not a financial advisor. Do your research before investing your funds in any financial asset or presented product or event. We are not responsible for your investing results.


Leave a Reply